You now understand what algorithmic trading is and how AI has demolished the barrier between knowing and doing. This chapter gets practical. We're going to walk through how to build trading tools using AI — the right way, avoiding the traps that catch most people.
The Prompt Engineering Mindset
The quality of what AI builds for you depends entirely on the quality of how you describe what you want. Vague prompts produce vague tools. Precise prompts produce precise tools. This isn't a metaphor — it's the literal reality of how these systems work.
If a human developer would need to ask you follow-up questions before building what you described, your prompt isn't specific enough. Rewrite it until every variable, threshold, condition, and output format is explicitly stated.
This discipline — forcing yourself to describe your trading strategy in precise, unambiguous language — has a powerful side effect. It makes you a better trader. Most traders have vague strategies. "I buy stocks that look strong." What does strong mean? How do you measure it? At what threshold do you act? The moment you try to describe it to an AI, you discover how imprecise your thinking is. The prompt forces clarity.
Building a Screening System
Let's walk through building a real tool. You want to find swing trading opportunities that align with the Grade A criteria.
Step 1: Define Your Criteria
Before you open any AI tool, write down exactly what you're looking for.
Macro alignment: The stock's sector is in the "best performing" list for the current macro regime.
Trend: The stock is above its 50-day moving average and the 50 is sloping upward.
Signal: The price has pulled back to within 2% of the 20-day moving average (buy-the-dip entry within a trend).
Volume: Today's volume is at least 80% of the 20-day average (not dried up).
Filter: Market cap above £2 billion (liquid enough to trade without slippage).
Step 2: Ask the AI to Build It
Describe all of the above in a prompt, then ask for a script that scans a universe of stocks and returns a ranked list of candidates. The AI will write the code, including the data download, calculations, and output formatting.
The first version won't be perfect. It never is. You iterate. "The moving average calculation uses close-to-close. Can you change it to use the daily high?" The AI adjusts in seconds.
Step 3: Test It on Historical Data
"For every stock this screener would have flagged over the last five years, what happened in the 10 trading days after the flag? What was the average return? Win rate? Maximum drawdown?"
If the results show a 60% win rate with 3.5% average gain and 1.8% average loss, you have statistical evidence your criteria have genuine predictive value.
Step 4: Automate the Daily Run
Set it up to run automatically every evening after the market closes. Scan the universe, generate the ranked list, and email you the top 5 trades each morning.
The entire process — from idea to working automated scanner — can happen in a single afternoon.
Backtesting: The Truth About Historical Performance
Backtesting is the process of applying your trading rules to historical data to see how they would have performed. It's the most powerful tool available for validating a strategy — and also the most dangerous one, because it's extraordinarily easy to fool yourself.
The Overfitting Trap
You build a strategy returning 15%/year. Not bad, but you want better. So you add a filter. Backtest improves to 18%. Another filter. 21%. Another. 24%. Each makes historical performance look better.
But you haven't improved the strategy. You've tortured the data until it confessed. Each filter was "discovered" by looking at what would have worked in the past. When you run this in live markets, it fails catastrophically — because those filters are describing the past, not predicting the future.
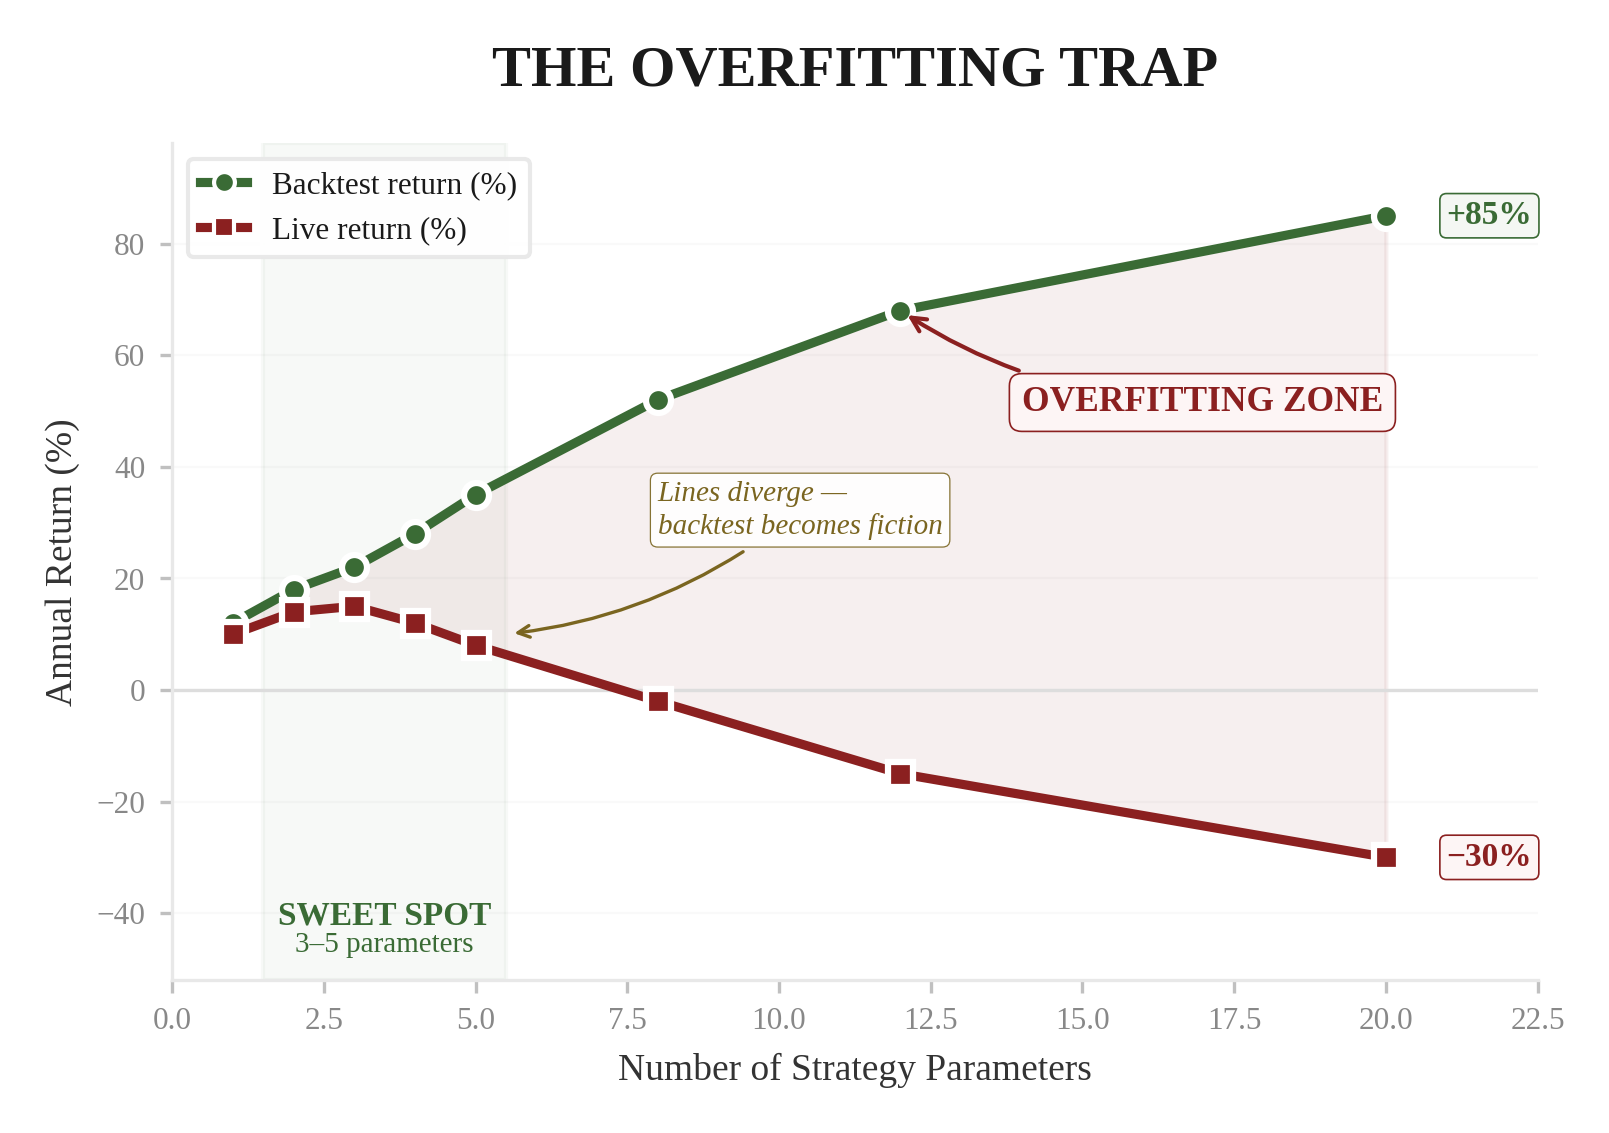
If your strategy has more than 3–5 parameters, you're probably overfitting. The best strategies are simple. One or two entry conditions. One exit condition. A clear macro filter. That's it.
If you need twelve variables and a neural network to make it work on historical data, it won't work in real life.
Out-of-Sample Testing
The antidote to overfitting is out-of-sample testing. Develop your strategy using data from 2010–2020. Then test it on data from 2020–2024 — data the strategy has never seen. If it performs similarly on both periods, the trade is likely real. If it performs brilliantly on the development data and terribly on the test data, you've overfit.
"Develop the strategy on the first 70% of the data and test it on the remaining 30%. Don't optimise any parameters using the test period." This one instruction separates real systems from beautiful illusions.
Regime Awareness in Backtesting
A strategy that worked from 2010 to 2020 was operating primarily in a low-inflation, accommodative central bank environment. If you test it across that period alone, you're testing it in one regime. The moment the regime shifts — as it did in 2022 — the strategy collapses.
When you backtest, ask the AI to tag each period with its macro regime and show performance by regime. A genuinely robust strategy should be profitable in at least 3 of 4 regimes, or it should be explicitly designed for specific regimes with clear rules for when to switch off.
A trader I know built what he thought was a bulletproof momentum strategy. It returned 28%/year from 2012 to 2021. He went live in January 2022. By June, he was down 35%. The strategy had been tested exclusively during the longest bull market in history. It had never experienced Regime 3.
He rebuilt the system with regime filters — the strategy only runs in Regimes 1 and 2, and switches to defensive in Regimes 3 and 4. The returns in backtesting were lower (19% versus 28%) but the drawdowns were dramatically smaller and the performance persisted across all market conditions.
Building a Risk Dashboard
One of the highest-value things you can build with AI is a personal risk dashboard — or use our free tools and calculators as a head start. Here's what to ask for:
Every open position with current price, entry price, % gain/loss, and current grade.
Exposure by sector, asset class, and macro regime sensitivity. See concentration risk instantly.
Current drawdown from all-time high. Alert when it exceeds your predefined 10-15% limit.
How correlated your positions are. If all five move together, you're one bet spread across five names.
For each position, the setup-based exit and distance from it. Which positions need watching?
Real-time grade status for all positions. Instant alert on any downgrade from A to B or below.
A risk dashboard like this — which would have cost £10,000+ to build a few years ago — can now be created in an afternoon through conversation with an AI. And unlike a commercial tool, it's perfectly customised to your specific strategy and risk tolerance.
The Iterative Development Process
The best way to build trading tools with AI is iteratively. Don't try to build everything at once. Start small. Get one thing working. Then add to it.
Build a simple screener that flags stocks meeting your basic entry criteria. Run it manually each evening. Check the results against your own analysis.
Add macro regime awareness. The screener now only shows trades in sectors aligned with the current regime. Add a grade column.
Backtest the screener's historical flags. How did they perform? Adjust criteria based on data — but maximum 1–2 changes. Resist the overfitting urge.
Build the risk dashboard for current positions. Start tracking performance, drawdown, and exposure.
Automate the daily run. Add email alerts for new flags and position warnings. Refine based on real-world use.
Add sophistication gradually. Correlation monitoring. Earnings date flags. Regime change alerts. Each addition is a conversation with the AI.
Start small. Get one thing working. Then add. Each week builds on the last. By month 4, you have a system that would have taken a quant developer months to build — and it's customised exactly to your strategy. While you build, start a free trial to see a professional system in action.
Part Five complete. Next: Part Six — Long-Term Investing. The three-pillar framework for building wealth that lasts decades.
- 1.The quality of what AI builds depends entirely on how precisely you describe what you want — vague prompts produce vague tools.
- 2.The overfitting trap: if your strategy needs more than 3-5 parameters, you're probably fitting the past, not predicting the future.
- 3.Build iteratively — start with a simple screener in Week 1, add macro awareness in Week 2, backtest in Week 3, automate in Week 4.
This content is for educational purposes only and does not constitute investment advice. Trading and investing involve substantial risk of loss. Past performance is not indicative of future results. Always do your own research and consider seeking professional guidance before making financial decisions.