Let me tell you about two people.
This chapter explains why swing trading is the optimal approach for the vast majority of people — and why the grading system we've built is specifically designed for it.
What Swing Trading Is
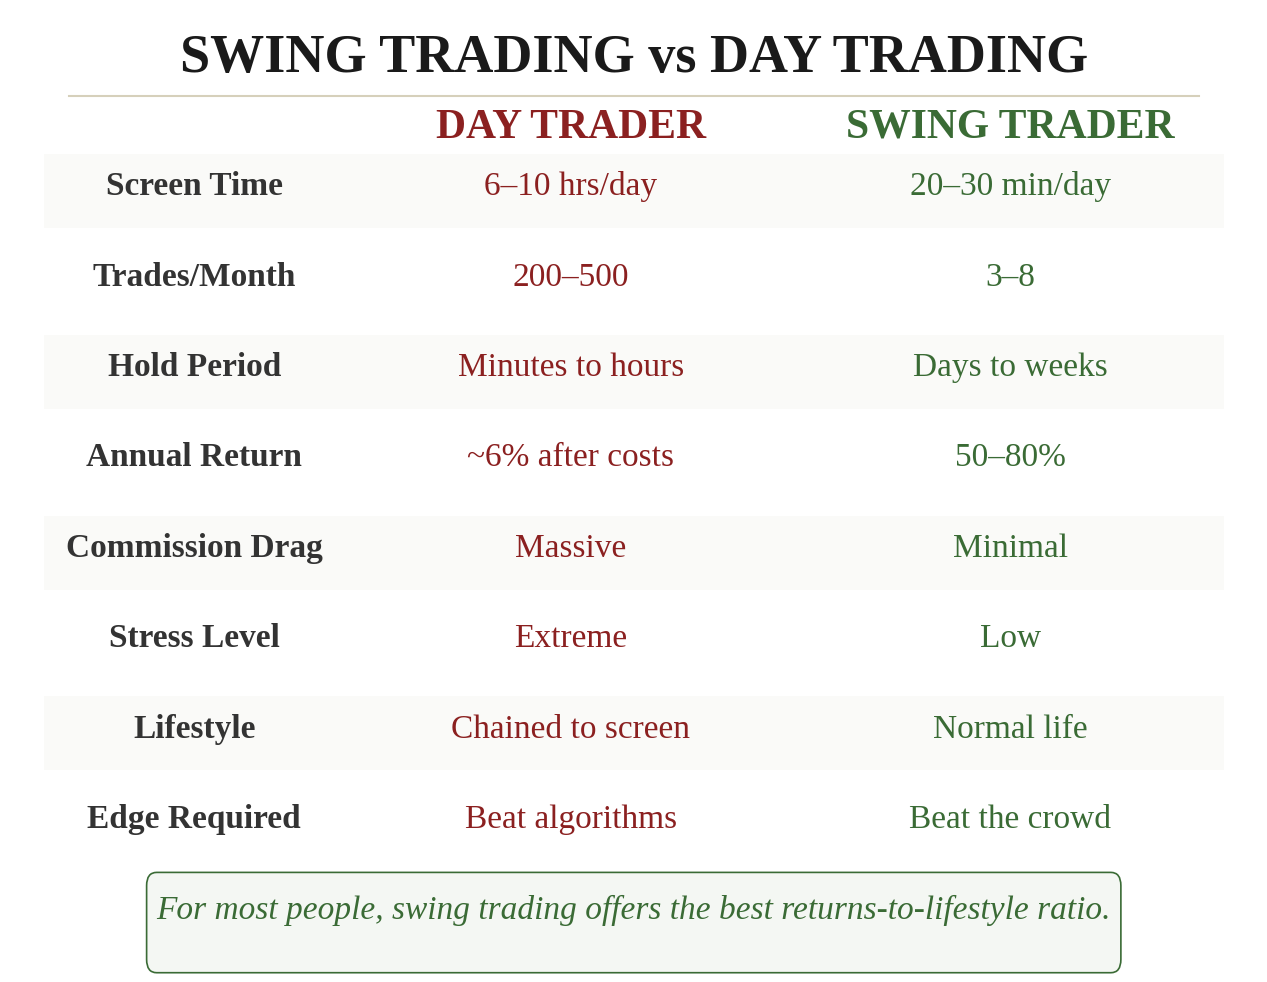
Swing trading means holding positions for days to weeks, capturing medium-term price movements. You're not trying to profit from minute-to-minute fluctuations like a day trader. And you're not holding for months or years like a long-term investor. You're occupying the middle ground — the sweet spot where the effort-to-return ratio is highest.
A typical swing trade looks like this: you identify a Grade A or B opportunity on Monday morning. The macro regime supports the asset. The mathematical signal confirms the entry. You buy at the entry signal. Over the next 5–10 trading days, the asset moves in your direction. You update your exit signal daily. When it hits, you take profit. Total active time: about 20 minutes per day.
That's it. No intraday drama. No stop-watching. No frantic adjustments every time the price ticks down half a percent. You set your orders, live your life, and let the trade develop.
Why the Middle Ground Wins
There's a concept in statistical mechanics called the "optimal observation interval." The idea is simple: if you check something too frequently, you see noise. If you check too infrequently, you miss signals. There's a sweet spot in between where the setup-to-noise ratio is highest.
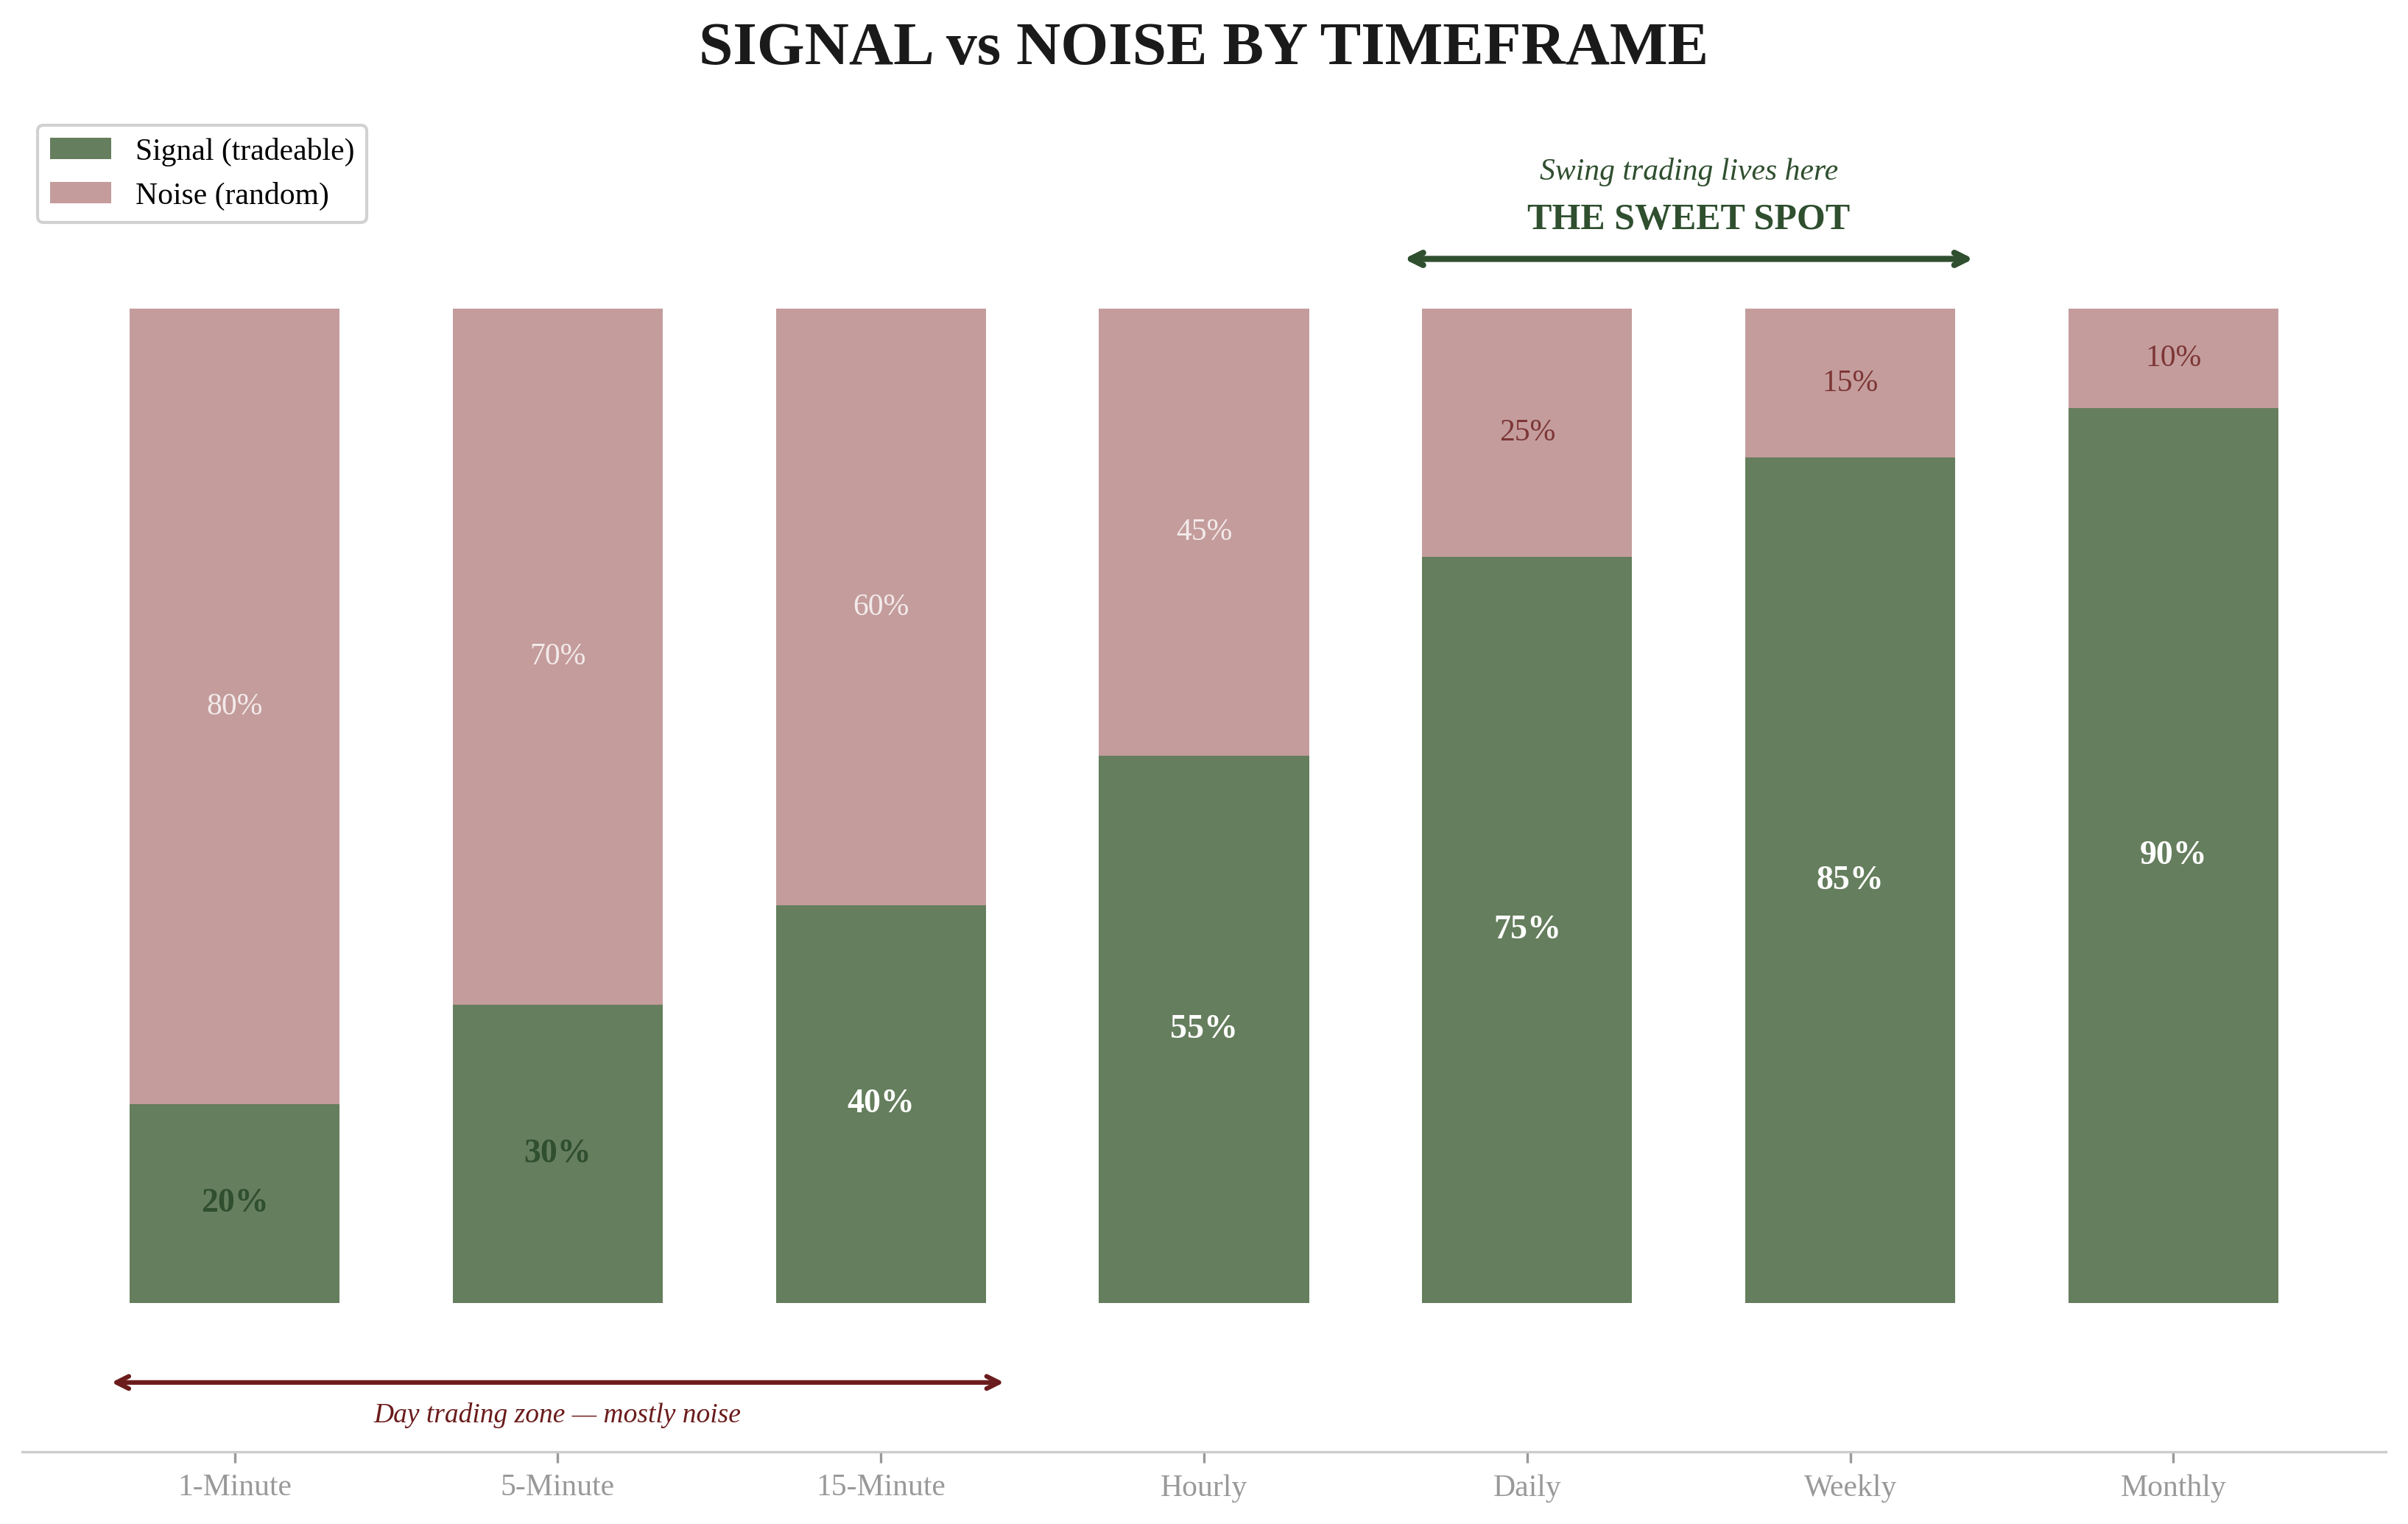
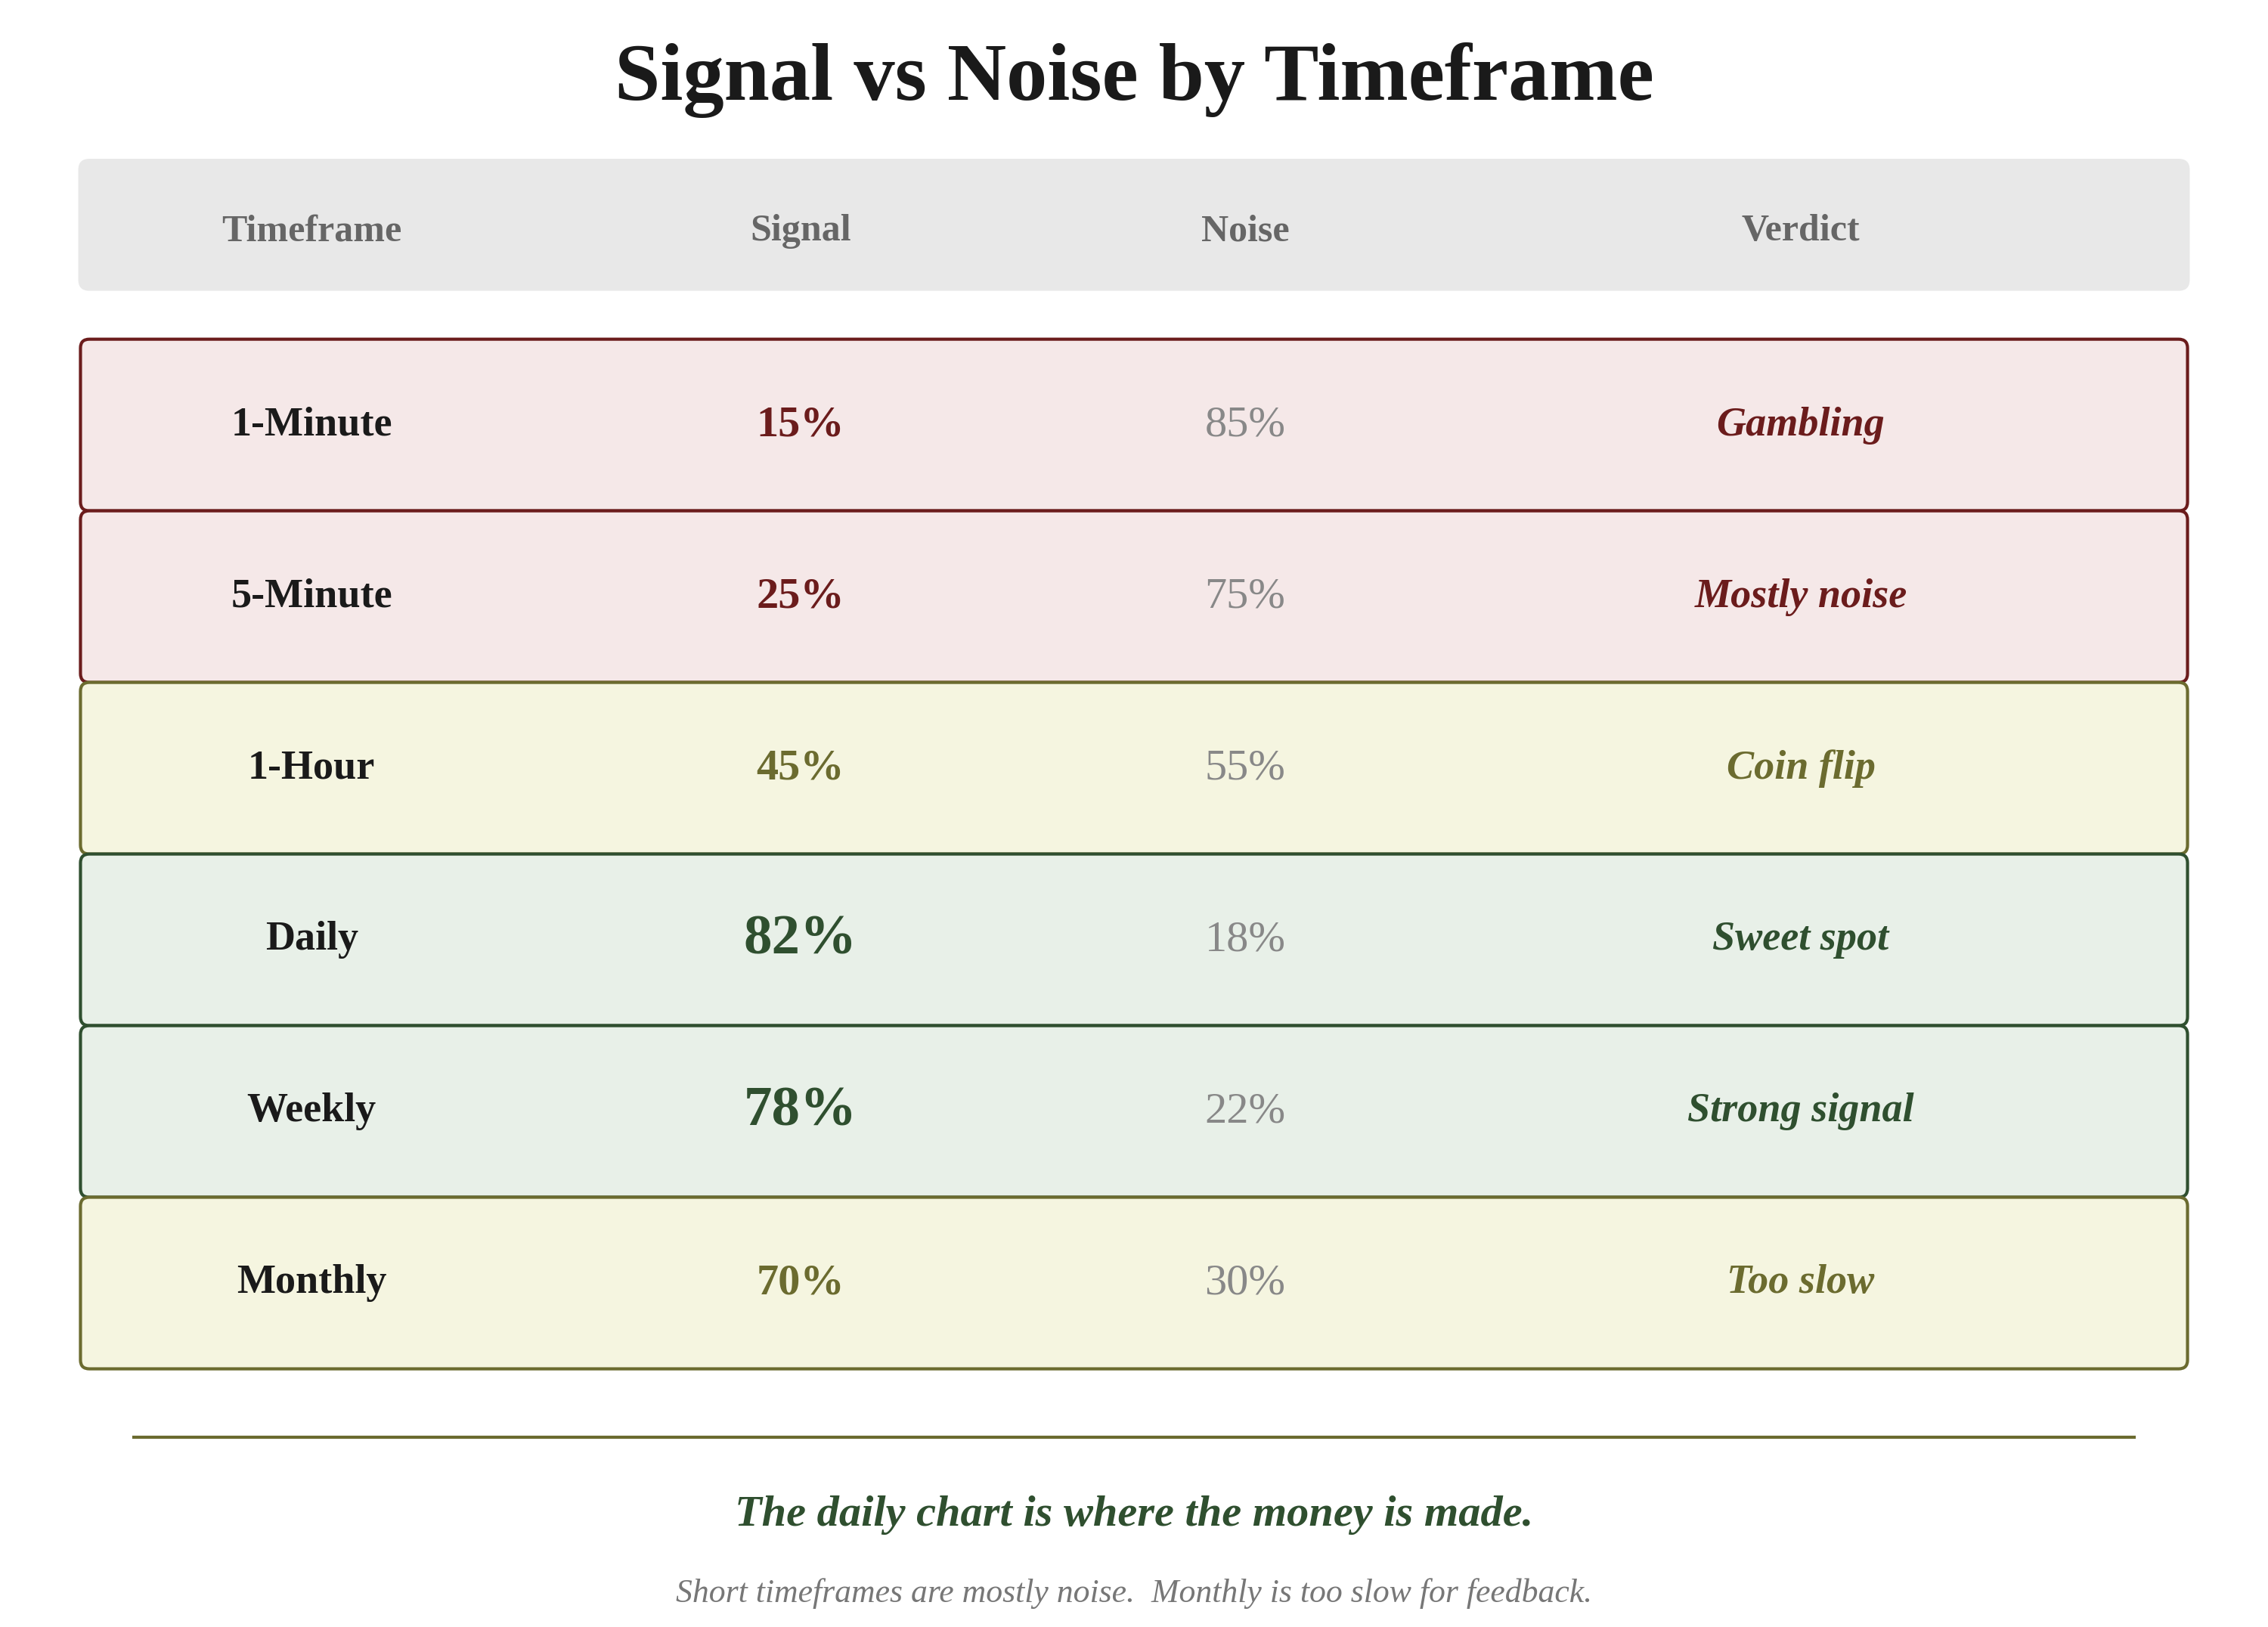
Markets work the same way. On a 1-minute chart, almost everything you see is noise — random fluctuations driven by algorithms, market makers adjusting quotes, and retail traders reacting to nothing. The setup-to-noise ratio on a 1-minute chart is terrible. You're trying to find a needle in a haystack of randomness.
On a monthly chart, the trade is clear but the feedback loop is too slow. You might identify the correct trend, but you won't get a useful entry setup for weeks or months. By the time you act, a significant portion of the move has already happened.
The daily and weekly timeframes — the swing trader's territory — hit the sweet spot. Daily charts filter out most of the intraday noise while still showing you the trend, the support, the resistance, and the volume patterns that matter.
Research in quantitative finance consistently shows that trend-following strategies perform best on intermediate timeframes — holding periods of several days to several weeks. Too short and transaction costs eat your profits. Too long and you give back too much during reversals. The middle ground is where the edge is sharpest.
The Psychological Edge
One of the most important discoveries in behavioural economics is a phenomenon called myopic loss aversion, identified by Nobel laureate Daniel Kahneman and economist Richard Thaler. The research showed that investors who checked their portfolios frequently perceived more risk, traded more, and earned less than those who checked infrequently.
In a landmark experiment, researchers divided participants into two groups managing identical portfolios. One group saw returns every day. The other saw returns once a year. The daily-checkers invested far more conservatively and earned dramatically less. Why? Because on any given day, a good investment has a roughly 50/50 chance of being up or down. Over a year, the odds shift heavily in your favour. But if you're checking every day, you feel like you're losing half the time — even when you're winning.
The big money was made not in the buying or the selling, but in the waiting.
Swing trading gives you this psychological edge by design. You're not watching every tick. You're not seeing the intraday dips that trigger fear and the intraday spikes that trigger greed. You check once in the morning, set your orders, and step away. The emotional toll is dramatically lower than day trading.
The best decision-making framework isn't the one that requires the most discipline. It's the one that requires the least — because it removes you from the environments where bad decisions happen.
Swing trading removes you from the intraday noise that triggers emotional reactions. It's not about being stronger than your emotions. It's about not being exposed to them in the first place.
Why It Fits the Grading System Perfectly
The entire system we've built in this book — the macro regime, the Grade A–E framework, the execution process — is optimised for swing trading timeframes. You can see free sample trades to understand how this plays out with real trades.
The macro regime changes over weeks to months. That's your strategic direction. The mathematical signals generate entry and exit levels on a daily basis. That's your tactical timing. The grade is assessed and updated daily. That's your conviction filter.
All three of these inputs operate on the swing trading timeframe. The macro is too slow to be useful for day trading and too fast to be useful for multi-year investing. The trades are calibrated for multi-day holds, not minute-by-minute scalping. The grading system assumes you have time to build positions incrementally over days — which only works if you're holding for days to weeks.
When you trade on the daily timeframe, every tool in this book is working at its maximum effectiveness. That's not a coincidence. It's by design.
The Compound Effect
There's a concept in risk theory about the power of asymmetric payoffs — situations where the potential gain significantly exceeds the potential loss. The best strategies in life and markets are the ones where you risk a little to gain a lot, and you do it repeatedly.
Swing trading, done correctly, is the purest expression of this principle. Each Grade A trade risks 1–2% of your capital with a realistic target of 3–10%. The risk-reward ratio is fundamentally asymmetric in your favour.
Now add compounding. If you make 3% on a Grade A trade that lasts a week, and then deploy that capital into the next Grade A trade a week later, you're not adding returns — you're compounding them.
Let me make this concrete. You start with £10,000. After 12 months of disciplined swing trading — three Grade A trades per month, averaging 3% per trade:
| Month | Trades | Monthly Gain | Balance |
|---|---|---|---|
| 1 | 3 | 9.3% | £10,927 |
| 2 | 3 | 9.3% | £11,943 |
| 3 | 3 | 9.3% | £13,053 |
| 4 | 3 | 9.3% | £14,267 |
| 5 | 3 | 9.3% | £15,593 |
| 6 | 3 | 9.3% | £17,043 |
| 7 | 3 | 9.3% | £18,628 |
| 8 | 3 | 9.3% | £20,360 |
| 9 | 3 | 9.3% | £22,253 |
| 10 | 3 | 9.3% | £24,323 |
| 11 | 3 | 9.3% | £26,585 |
| 12 | 3 | 9.3% | £29,056 |
That's your £10,000 turning into nearly £29,000 in twelve months. A 190% return. Not from one spectacular trade. Not from a lucky gamble. From 36 disciplined, moderate-gain trades compounding on top of each other. Each individual 3% gain looks modest. Stacked together, they're transformative.
And this table is conservative. It assumes exactly 3% per trade, every time. In practice, some Grade A trades will yield 5%, 8%, even 12% when the macro alignment is strong and the trend runs further than expected. Those outlier winners turbocharge the compounding.
Who Swing Trading Is For
The goal of trading is not to make as much money as possible. The goal is to make good money while living a good life.
Swing trading is for you if you have a full-time job and can't stare at screens all day. It's for you if you want returns that meaningfully outperform benchmarks without sacrificing your health, your relationships, or your sanity. It's for you if you have the discipline to check once a day and walk away. It's for you if you value your time as much as your money.
It's also for you if you've already tried day trading and found it unsustainable — and ready to start a free trial of a system built for exactly this approach. This is more common than you'd think. A significant portion of people who eventually become excellent swing traders started as burned-out day traders. They had the analytical skills and the market knowledge, but they were destroying themselves physically and psychologically in the process.
It's not for you if you need constant action. If you genuinely enjoy the adrenaline of day trading and you're profitable at it, keep doing what works.
But if you're honest with yourself and your day trading results are mediocre — or you're exhausted, stressed, and not sure how much longer you can sustain it — swing trading is probably where you belong.
The next two chapters will show you exactly how to find swing trades and how to manage them from entry to exit.
- 1.Swing trading (holding days to weeks) offers the best setup-to-noise ratio, the lowest stress, and the highest risk-adjusted returns for most people.
- 2.The daily chart is where the money is made — 1-minute charts are 80% noise, daily charts are 75%+ signal.
- 3.Three Grade A trades per month at 3% each compounds to over 100% annually — with 20 minutes of daily screen time.
This content is for educational purposes only and does not constitute investment advice. Trading and investing involve substantial risk of loss. Past performance is not indicative of future results. Always do your own research and consider seeking professional guidance before making financial decisions.