Every morning, across every market in the world, thousands of assets are trading. Stocks, currencies, commodities, bonds, ETFs — the universe of things you could potentially trade is enormous. Most of them, on any given day, are not worth your time.
Your job is not to analyse everything. Your job is to filter ruthlessly until you're left with the handful of opportunities that meet Grade A or B criteria. This chapter teaches you the filtering process — step by step, from the macro level down to the specific trade.
Step 1: Read the Regime
Before you look at a single chart, answer two questions: which direction is growth heading, and which direction is inflation heading? This immediately tells you where to focus.
Let's say it's a Regime 1 environment — growth accelerating, inflation slowing. That immediately tells you where to focus your attention:
Favourable: Equities (especially tech, consumer discretionary, industrials), commodities, FX
Unfavourable: Fixed income, USD, defensive sectors like utilities and consumer staples
You've just eliminated half the investable universe in thirty seconds. You're not going to waste time looking at bond trades or utility stocks in Regime 1. They're swimming against the current. Focus your energy on the asset classes and sectors where the macro wind is at your back.
This step alone puts you ahead of 90% of retail traders, who pick assets based on what's trending on social media or what a friend mentioned at dinner. They're trading randomly. You're trading with the weight of the economy behind you.
Step 2: Scan for Trends
Within your favourable asset classes, look for assets that are already going up. Not assets that "look cheap." Not assets that "should go up." Assets in uptrends with higher highs and higher lows.
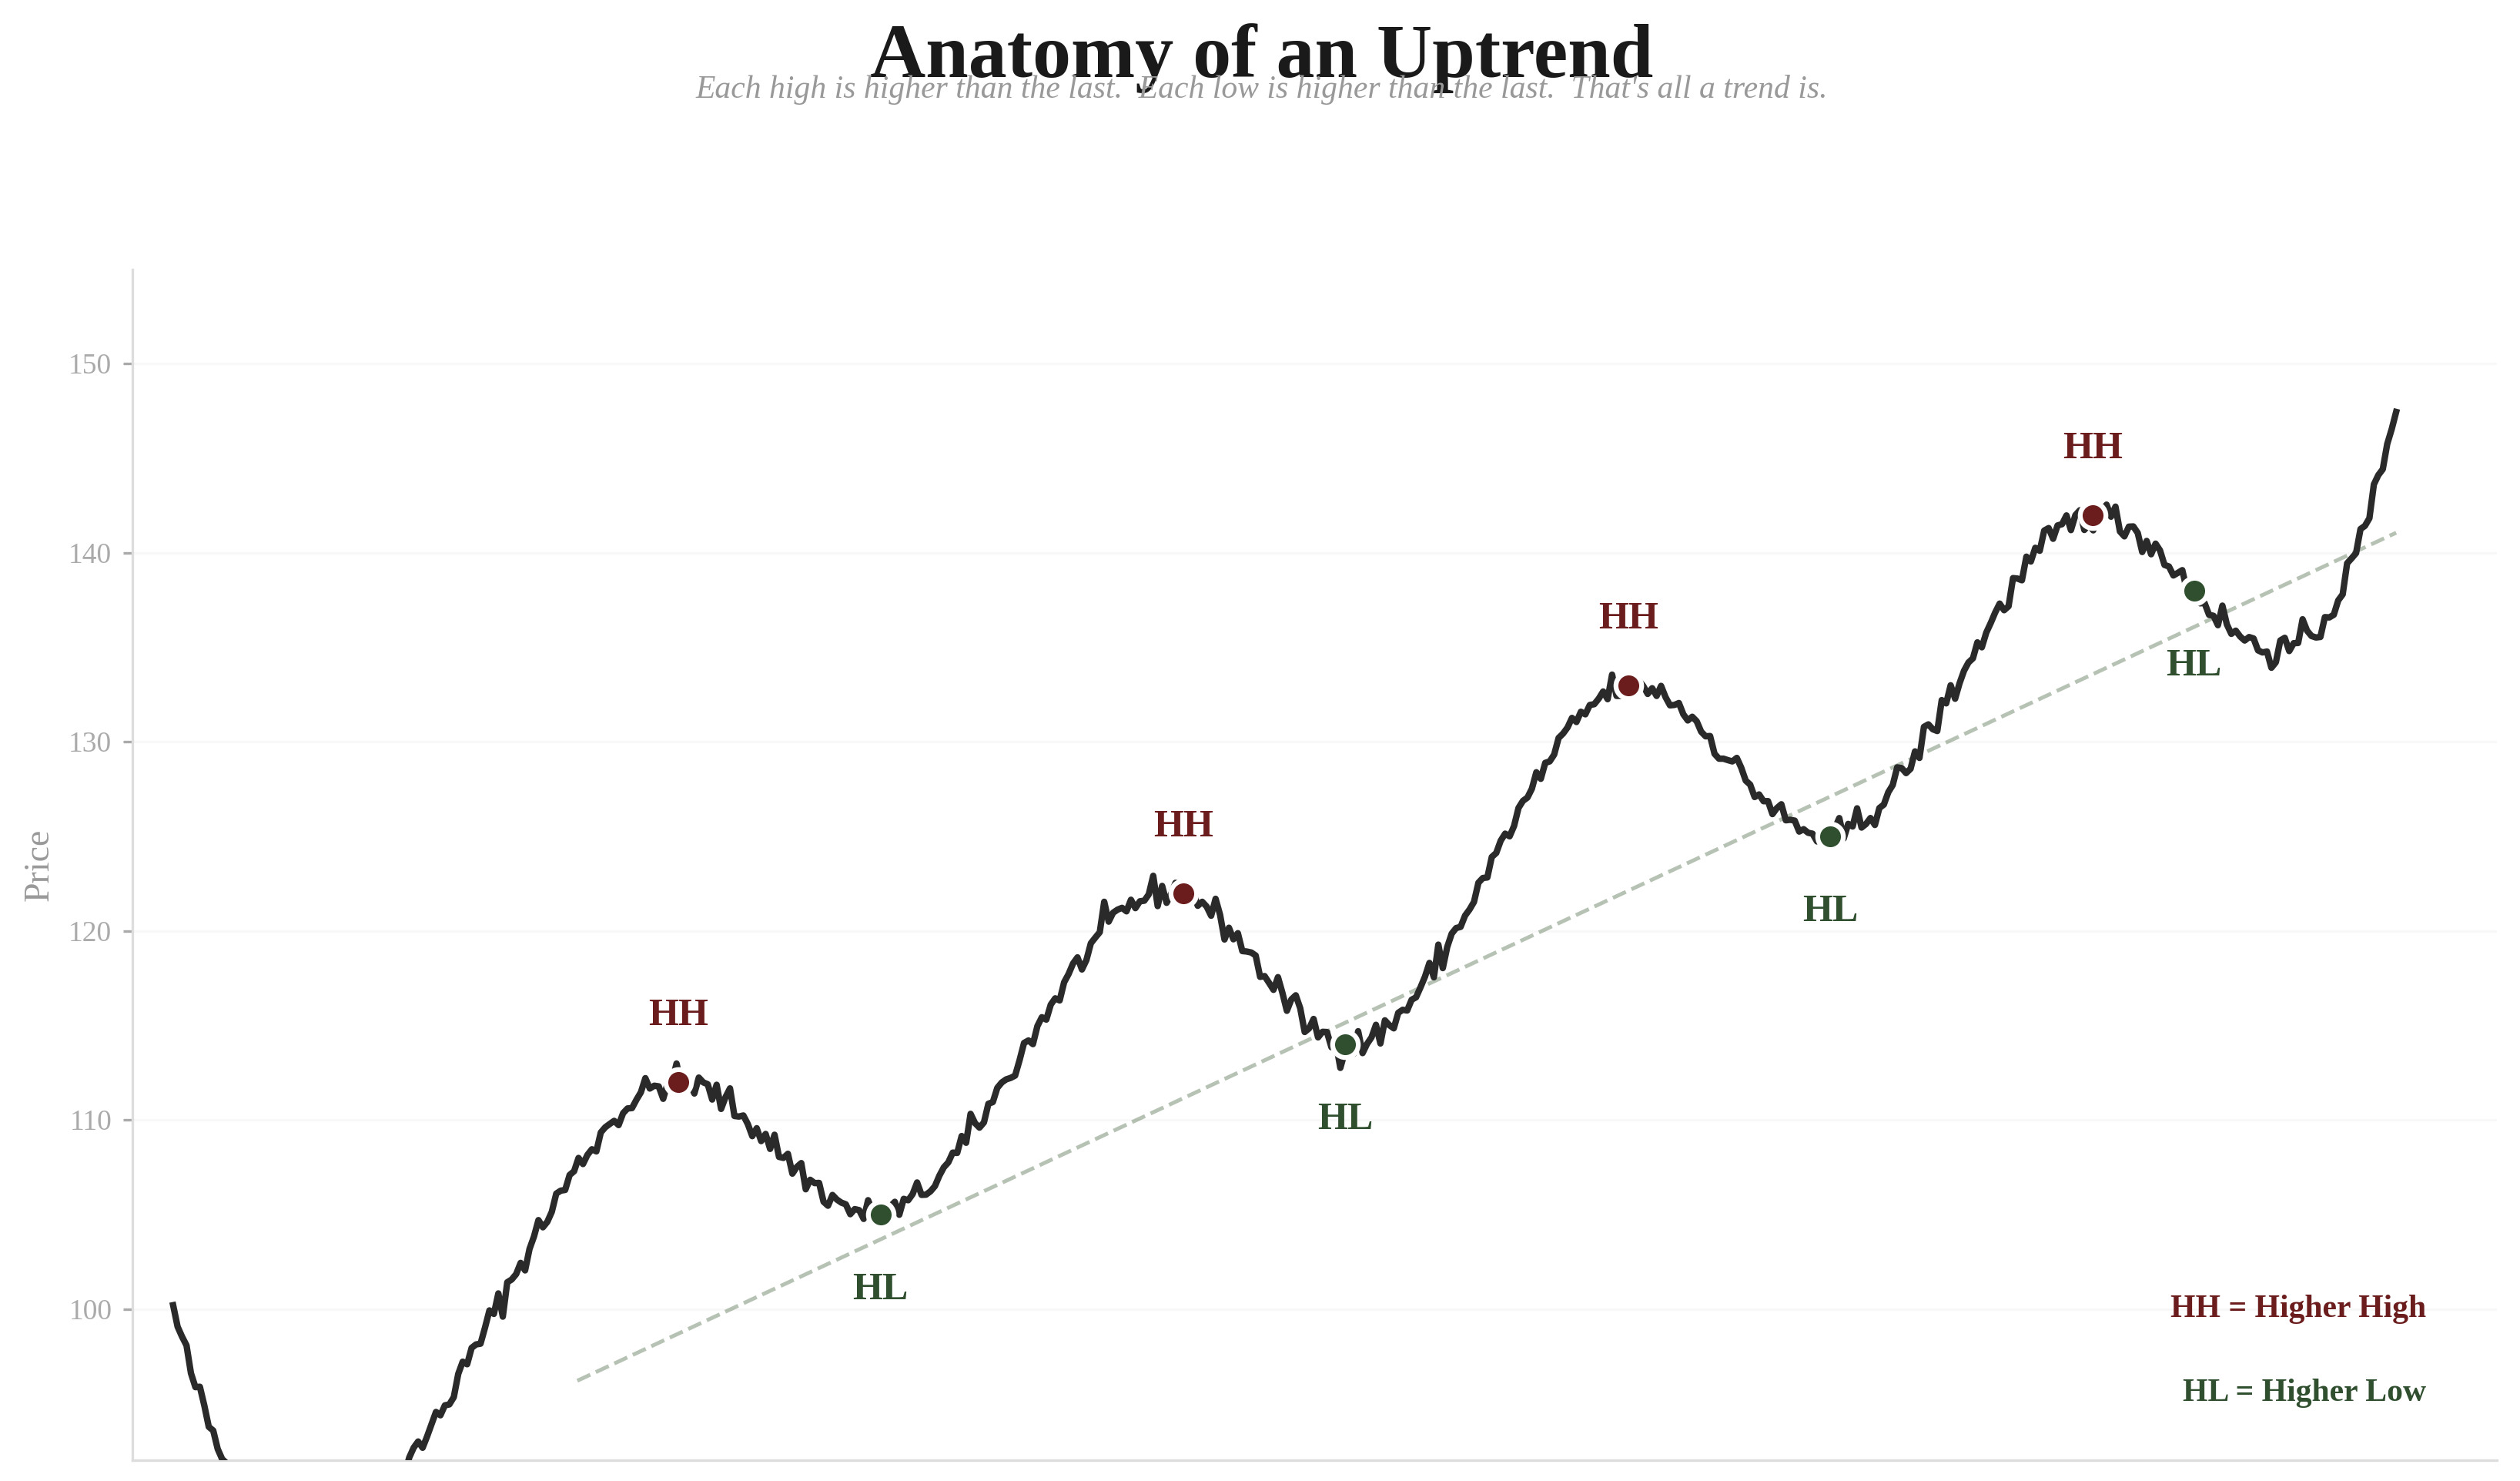
This is a crucial distinction. Most people try to buy things that have fallen and hope they bounce. This is called "catching a falling knife" and it's one of the fastest ways to lose money. A stock that's fallen 40% can always fall another 40%. A stock that's in an uptrend has institutional money behind it.
The research on momentum is overwhelming. Academic studies going back decades have consistently shown that assets that have been rising tend to continue rising, and assets that have been falling tend to continue falling. This is one of the most robust findings in all of financial economics.
Your scan is simple: pull up the daily chart. Is this asset making higher highs and higher lows? Yes? Keep it on the list. No? Move on. Don't try to be clever. Don't try to call the bottom.
Step 3: Identify the Entry Zone
You've found an asset in an uptrend, in a favourable sector, in a supportive macro regime. Now you need a specific price to enter. You do not chase.
Chasing — buying after a big move because you're afraid of missing out — is one of the most expensive habits in trading. It feels urgent. It feels like the opportunity will disappear if you don't act right now. That urgency is a lie.
Markets provide opportunities every single week. The one you're chasing will provide another entry if you're patient. And if it doesn't, there will be five other Grade A trades next month.
Instead, you wait for a pullback to support. In an uptrend, pullbacks are normal and healthy. They're the "step back" in the staircase pattern. The entry zone is where the pullback is likely to find buyers — a support level that has held before.
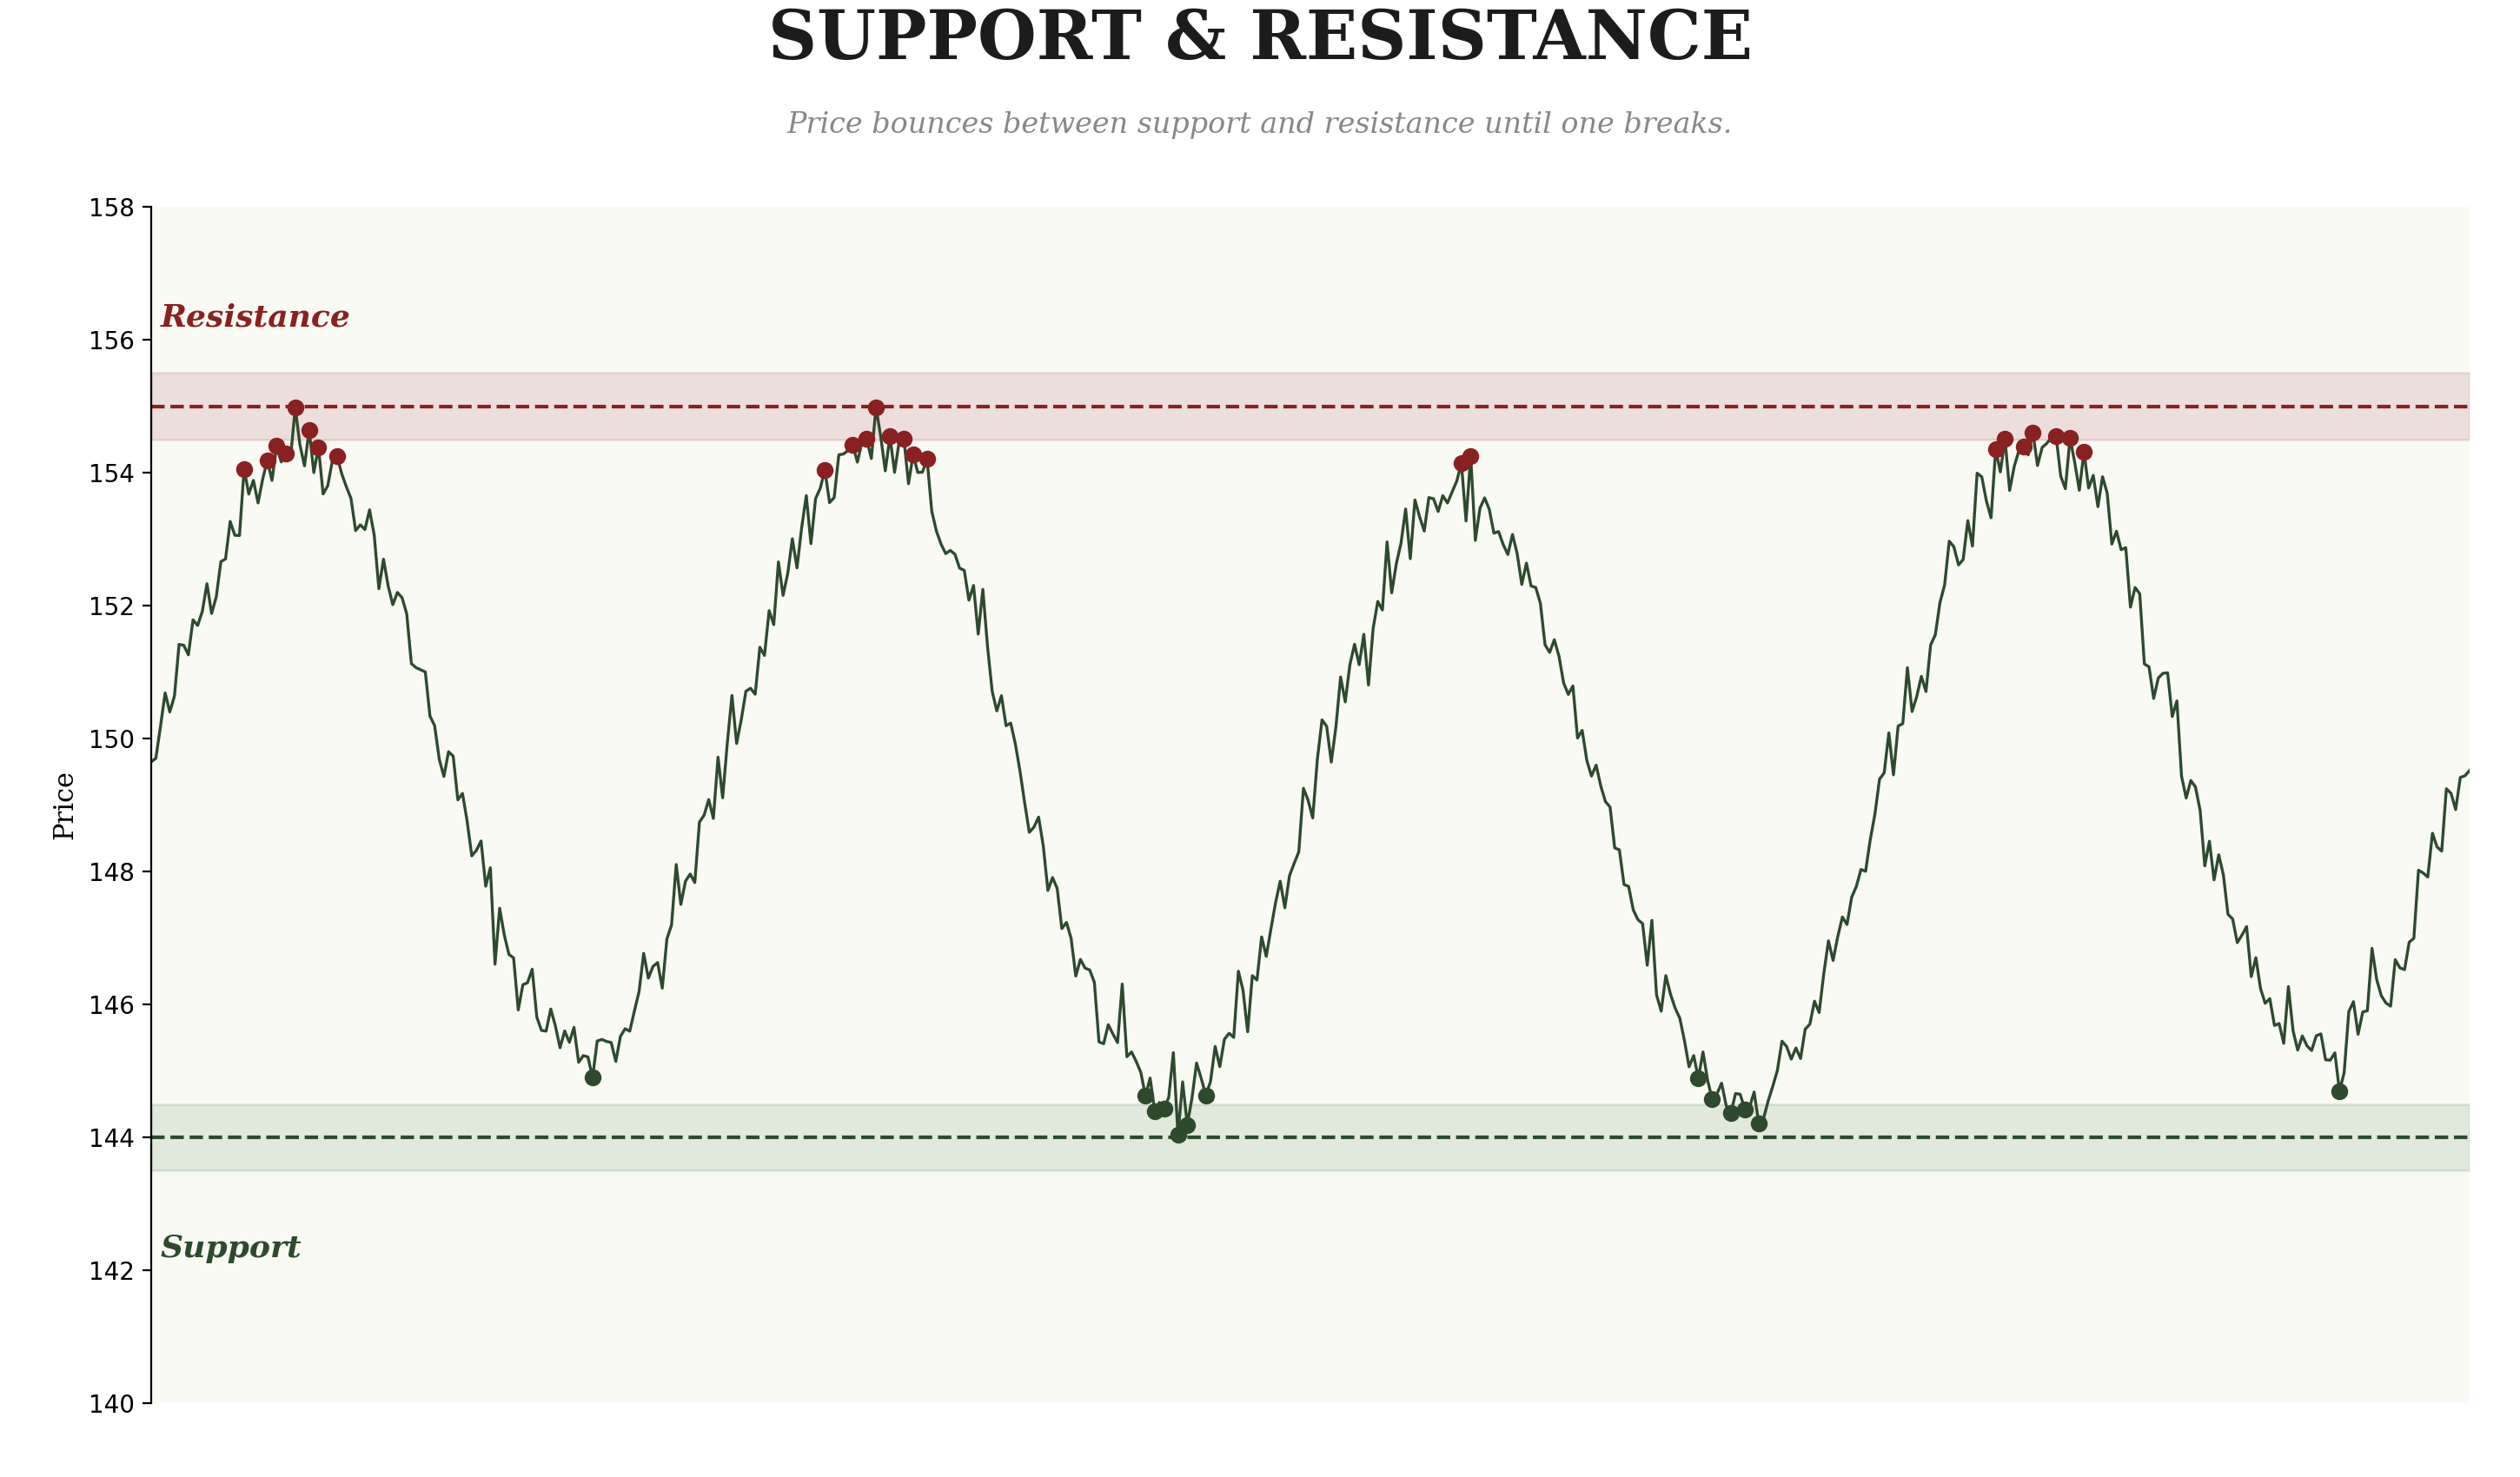
The algorithm generates this level for you. Each morning, it identifies the highest-probability entry point based on support, moving averages, volume profile, and recent price action. But even without an algorithm, you can estimate it yourself. Look at where the stock bounced in its last two or three pullbacks. That's your support. That's your entry zone.
Step 4: Confirm the Setup
The macro says go. The trend says go. You've identified your entry zone. Now the mathematical signal needs to confirm that the specific conditions for a high-probability entry are present right now.
This is where you need to think in probabilities, not certainties. No setup is 100% accurate. What you're looking for is a high-probability entry — one where the odds are meaningfully in your favour, perhaps 55–65%. That might not sound impressive, but a casino only needs a 51% edge to make billions.
Confirmation means the algorithm has identified that these factors are aligned:
Price action: Is the pullback holding at support? Is price forming a reversal pattern at the entry zone (a higher low, a bullish engulfing candle, a doji at support)?
Volume: Is selling volume drying up as price reaches support? Is buying volume starting to tick up? Sellers exhausting, buyers stepping in.
Momentum: Are short-term momentum indicators (rate of change, stochastics, RSI) reaching oversold levels? The pullback has gone far enough.
Volatility: Has volatility contracted? Periods of low volatility often precede big moves. A stock coiling in a tight range near support is loading energy.
When these factors align, the algorithm generates a confirmed entry signal. That's when you place your buy order.
Step 5: Grade It
The setup passes macro, trend, support, and signal confirmation. Now assign the grade. Grade A requires full alignment. Grade B means one element is slightly off. Anything below B? Skip it.
Grade A requires both the mathematical signal and the macro direction to be fully aligned. The regime supports the asset class and sector. The trend is intact. The setup is confirmed. There are no major uncertainties on the horizon. Browse our free sample trades to see what these graded trades look like in real time.
Grade B means one element is slightly off. Maybe the macro is supportive but there's a policy uncertainty clouding the outlook. Still tradable, but with reduced size and tighter exits.
If it doesn't make Grade A or B, you skip it. Period. There's no such thing as "close enough."
A Worked Setup: Finding a Grade A Stock Trade
Regime: Growth accelerating, inflation slowing. Tech and consumer discretionary favoured. Central bank neutral.
Scan: 30 tech stocks on watchlist. 18 in clear uptrends. 12 eliminated (rangebound or downtrending).
Filter: Of the 18, 7 are pulling back to support. The other 11 are at highs or mid-range. Focus on the 7.
Signal: 3 of the 7 have confirmed entry trades — price at support, volume drying up, momentum oversold.
Grade: One stands out. Large-cap tech, strong earnings momentum, support held three times. Macro is perfect. Signal confirmed. No events for two weeks. Grade A.
If the stock doesn't reach 224.50 today, nothing happens. You don't chase it. You don't adjust the entry. You wait. Tomorrow morning you'll check the updated signals and go through the same process. Patience is built into the system.
Common Mistakes When Finding Trades
Falling in Love With a Stock
You've done your research. You believe this company is exceptional. The product is great, the CEO is visionary, the industry is booming. But the stock is in a downtrend. The macro doesn't support the sector. The setup isn't there.
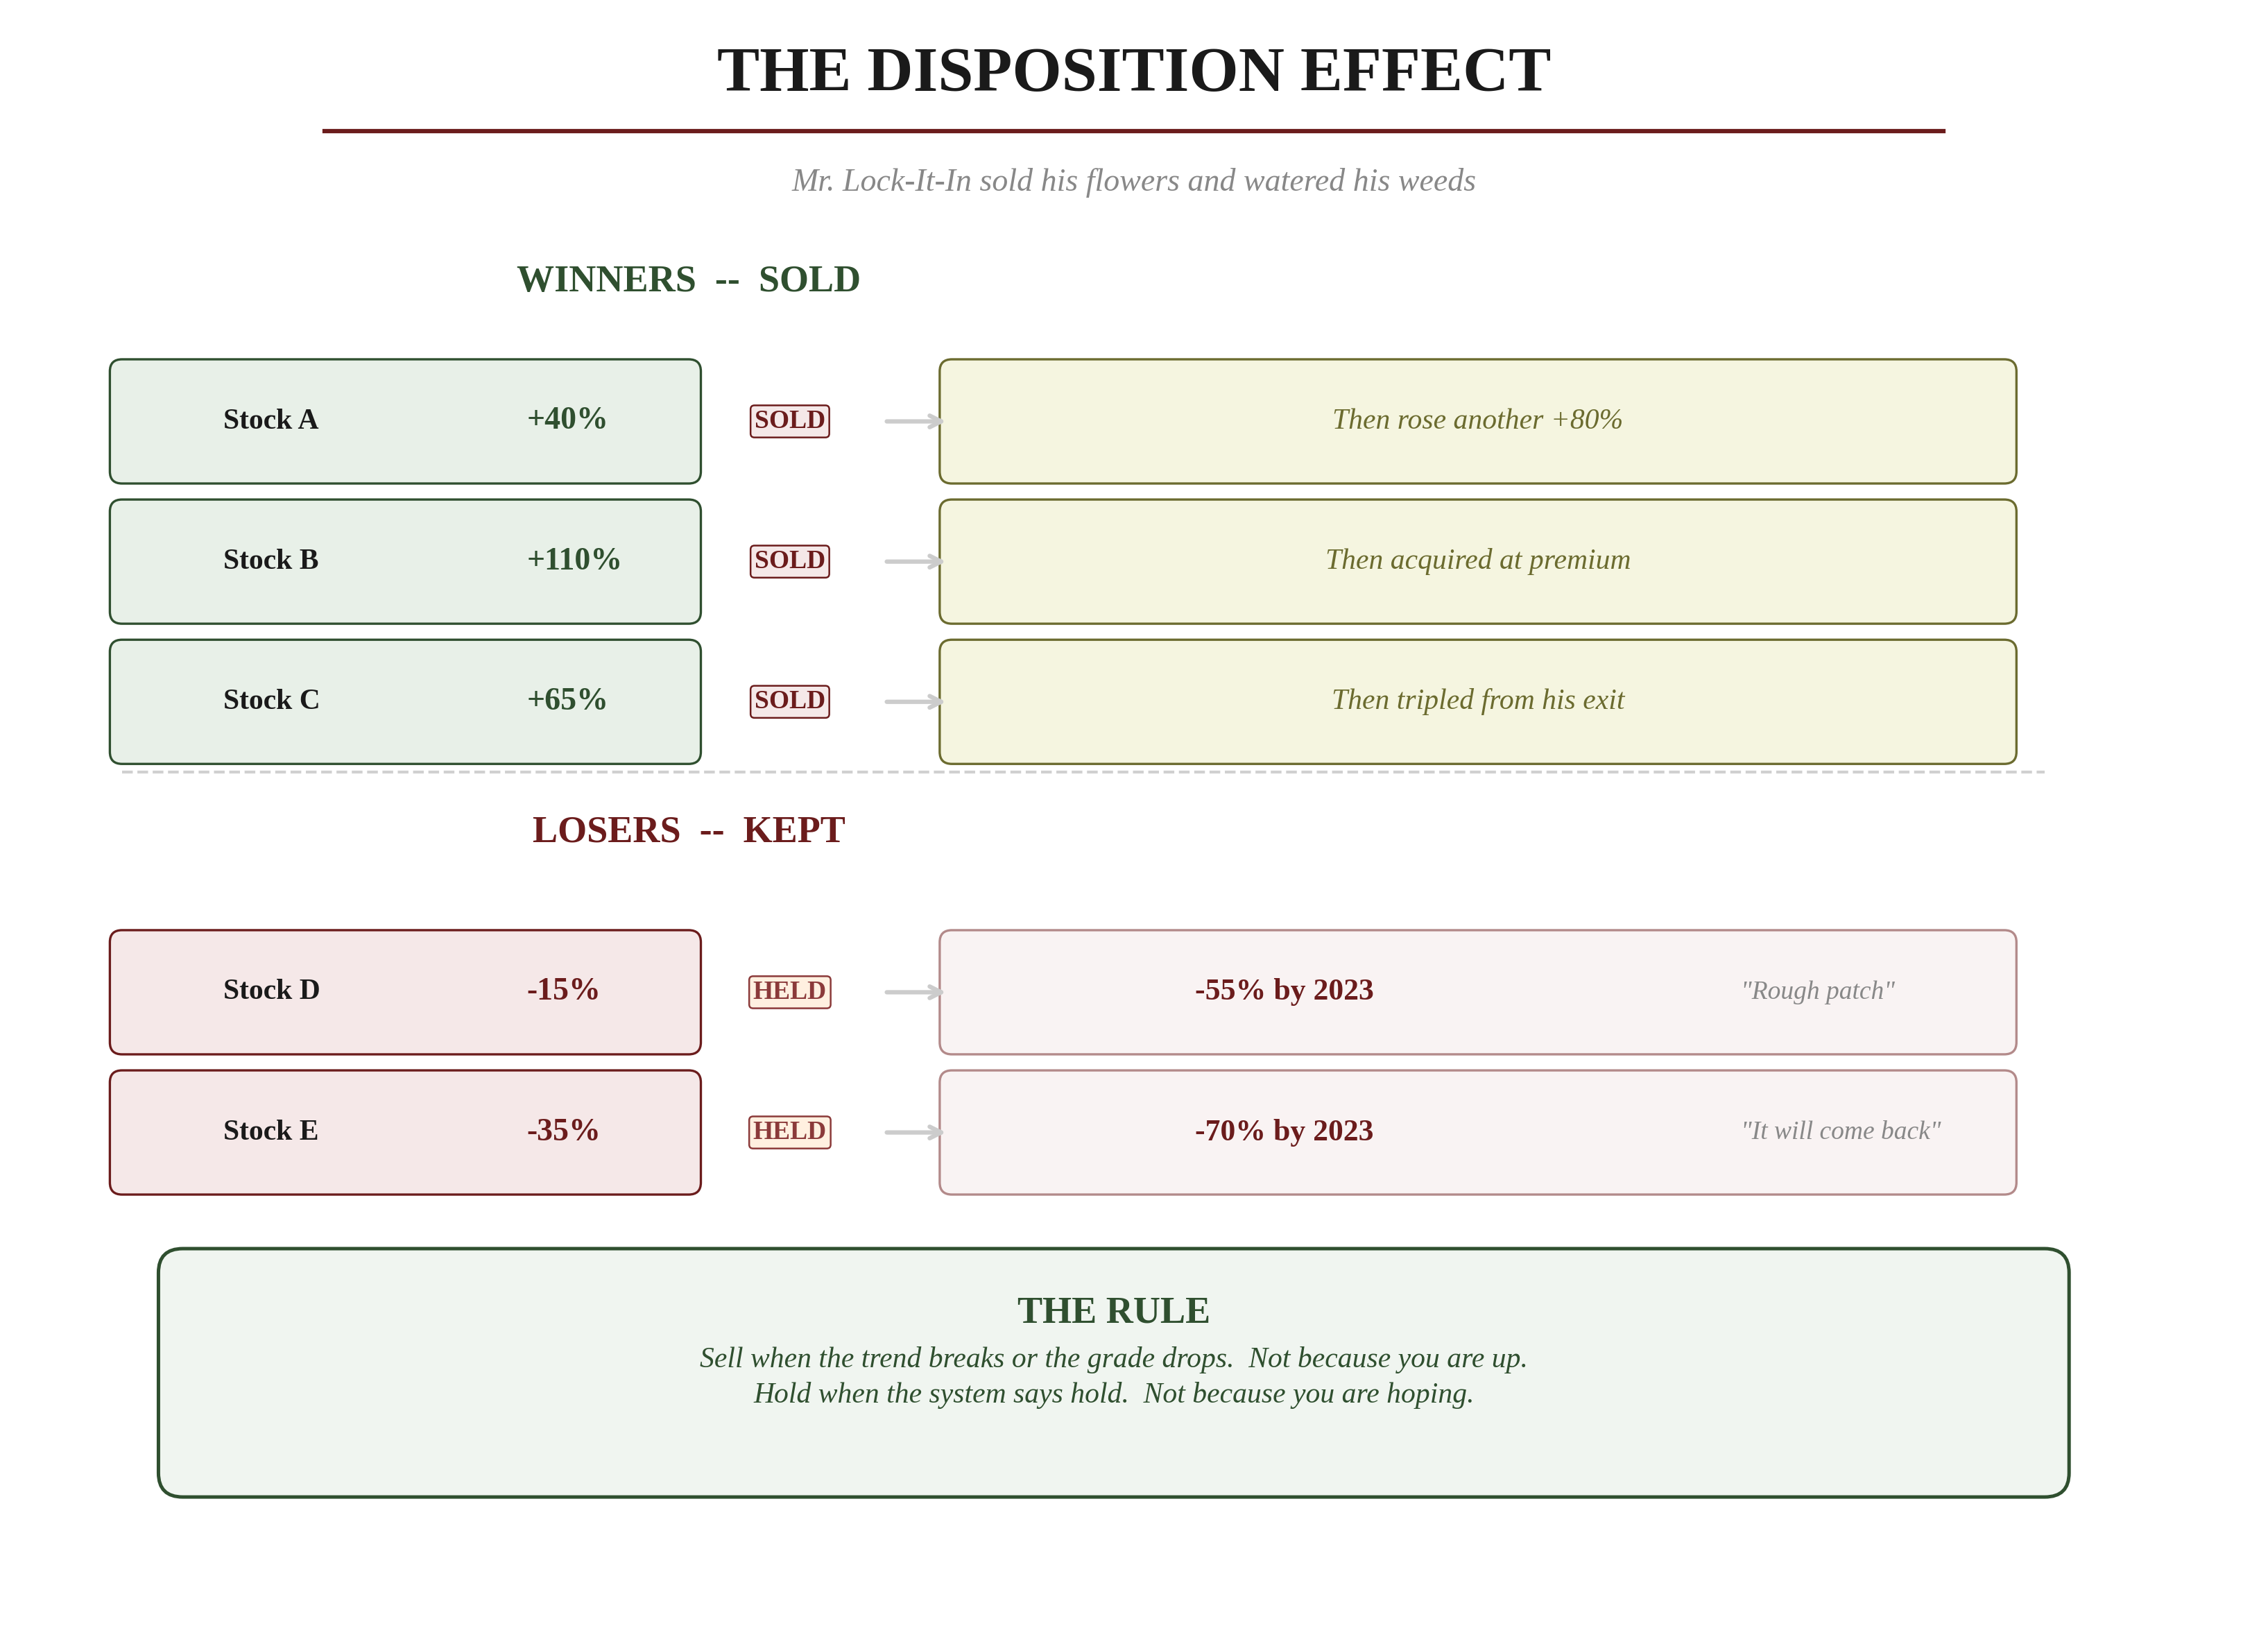
Trade it anyway? Never. Behavioural economists have identified the "endowment effect" — the tendency to overvalue things simply because you've invested time or energy in them. You've spent hours researching this company. That makes you biased. Your opinion about the company is irrelevant to the price. Price is primary.
Overcomplicating the Scan
Some traders run 47 indicators, overlay Fibonacci levels on Fibonacci levels, and end up so confused they either take no trades or take terrible ones. Analysis paralysis is a real and expensive condition.
Complexity is not intelligence. The most profitable traders use the simplest frameworks. Your scan uses three filters: regime, trend, signal. The regime takes 30 seconds. The trend check takes 5 seconds per chart. The setup either confirms or it doesn't. If you'd rather have this scanning done for you daily, start a free 7-day trial.
If you're spending more than 20–30 minutes finding trades, you're overcomplicating it.
Trading in the Wrong Regime
This is the most expensive mistake and the most avoidable. If you're buying equities in Regime 3 or 4 (growth slowing), you're swimming against a riptide. It doesn't matter how good the chart looks. The macro headwind will overpower the technical setup.
In early 2022, dozens of popular trading accounts were still calling for new highs in tech stocks. The charts looked "oversold." The pullback looked like a "buying opportunity." But the regime had shifted. Growth was decelerating. Inflation was surging. The central bank was pivoting to aggressive rate hikes. The macro was screaming "get out" while the chart-watchers were screaming "buy the dip." The macro won. It always does.
You now know how to find trades. The next chapter shows you how to manage them from entry to exit — the part where profits are made.
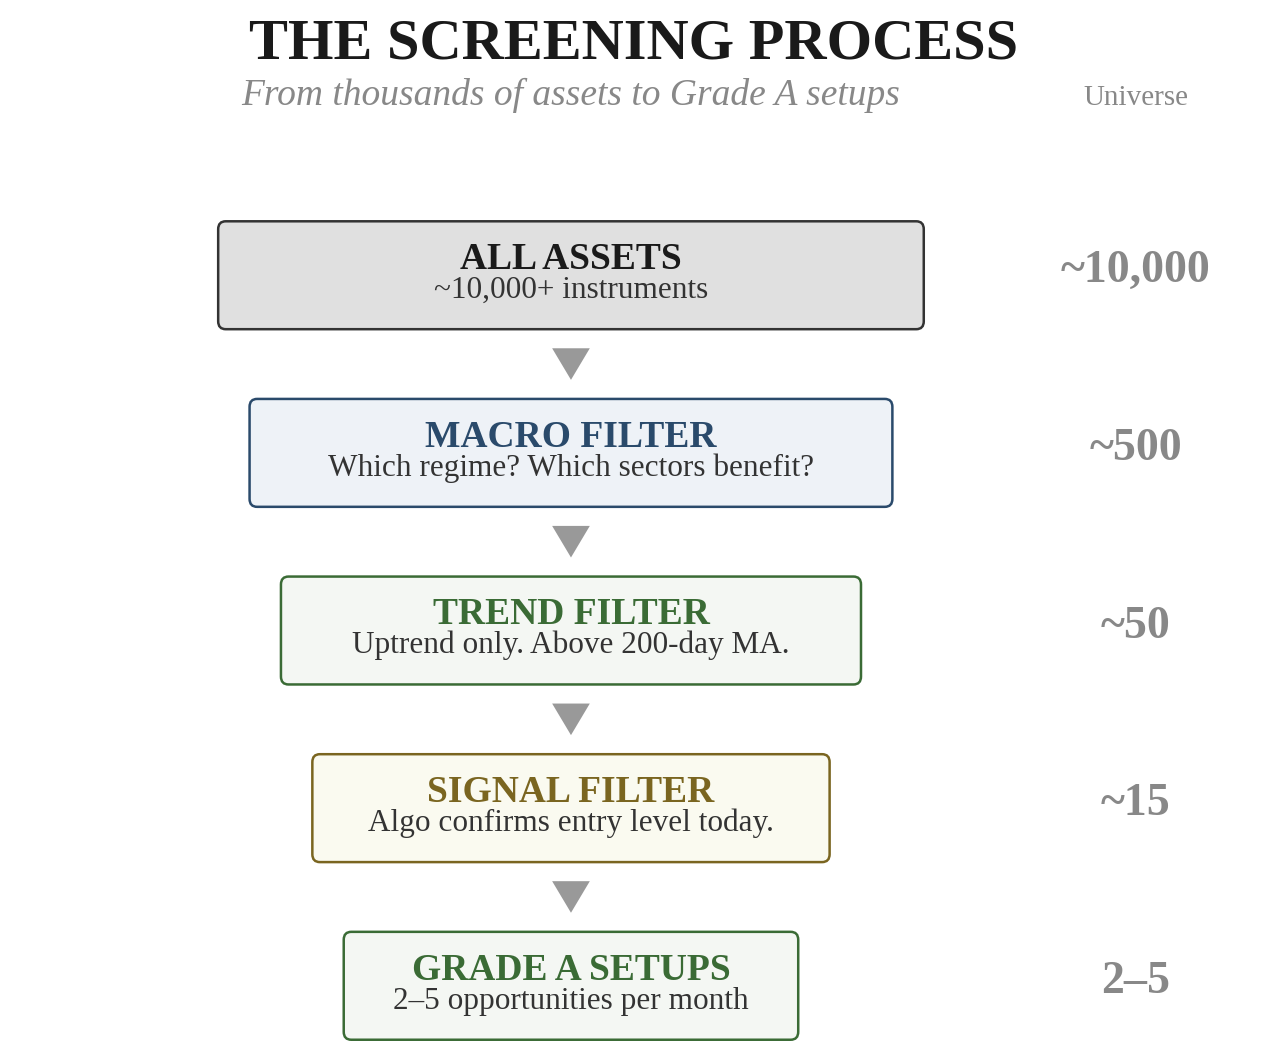
- 1.Filter ruthlessly: regime → trend → support → signal → grade. This narrows 10,000 assets to 2-5 opportunities.
- 2.Never chase — wait for pullbacks to support in confirmed uptrends. The market provides opportunities every week.
- 3.Simplify ruthlessly. If your scan takes more than 20-30 minutes, you're overcomplicating it.
This content is for educational purposes only and does not constitute investment advice. Trading and investing involve substantial risk of loss. Past performance is not indicative of future results. Always do your own research and consider seeking professional guidance before making financial decisions.