Finding the trade is the easy part. Any screener can spit out a list of stocks in uptrends. The skill — the part that separates the people who make money from the people who don't — is managing the trade from entry to exit over days and weeks.
The First Day: Entry
Your buy order has filled. You're in the trade. Congratulations. Now do nothing.
The first thing to understand is that nothing important is likely to happen today. The stock probably won't rocket to your exit level in a single session, and it probably won't crash through support. Most swing trades start boring. That's not a bug. That's a feature.
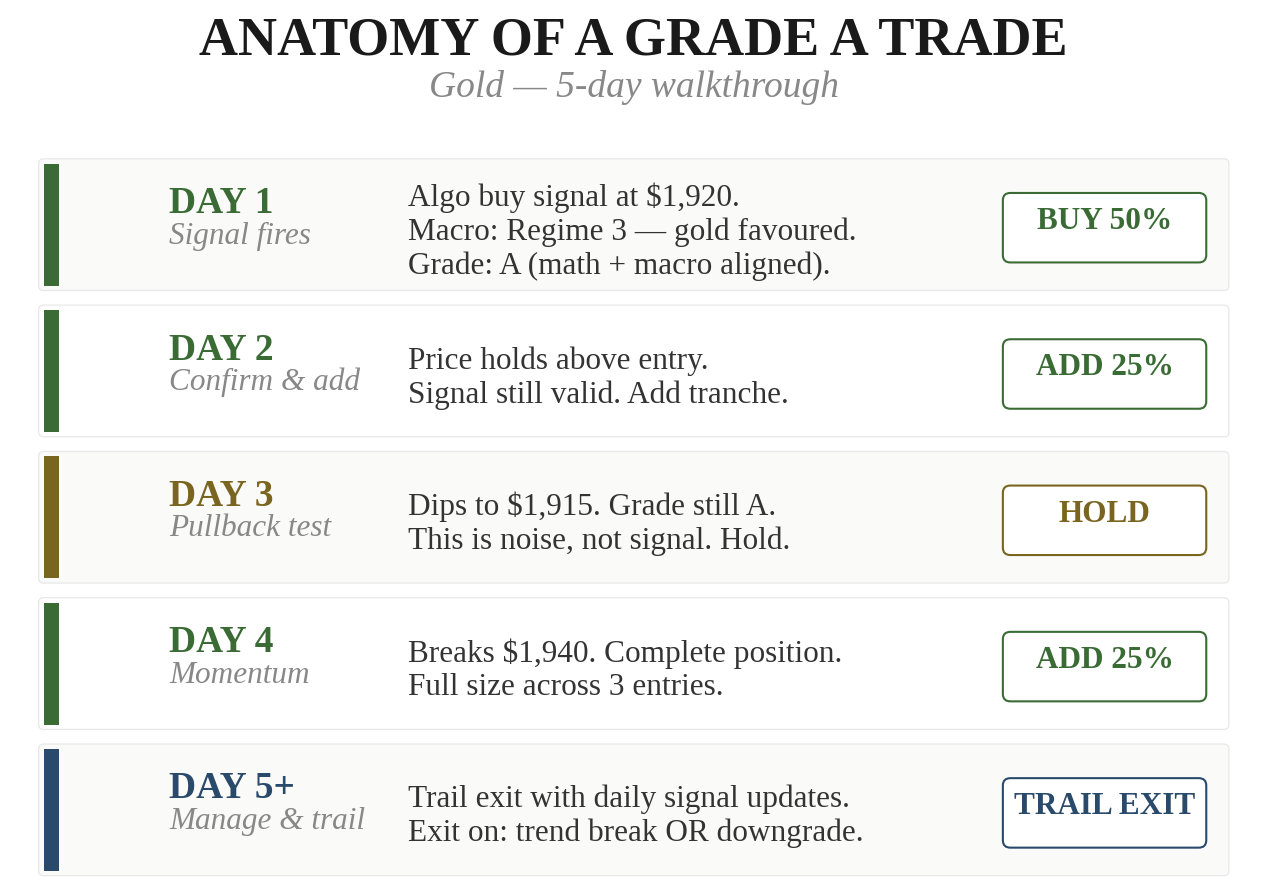
On the first day, you have a partial position. Remember the incremental building principle: never buy your full allocation in one go. On Day 1, you might deploy 40–50% of your intended position. This gives you room to add at better prices if the stock dips further, and it limits your exposure while the trade is still unproven.
At the end of Day 1, do a simple check: Is the grade still A or B? Is the trend still intact? If yes, you hold. If the grade has dropped to C or below, you reconsider immediately.
Days 2–5: Building and Watching
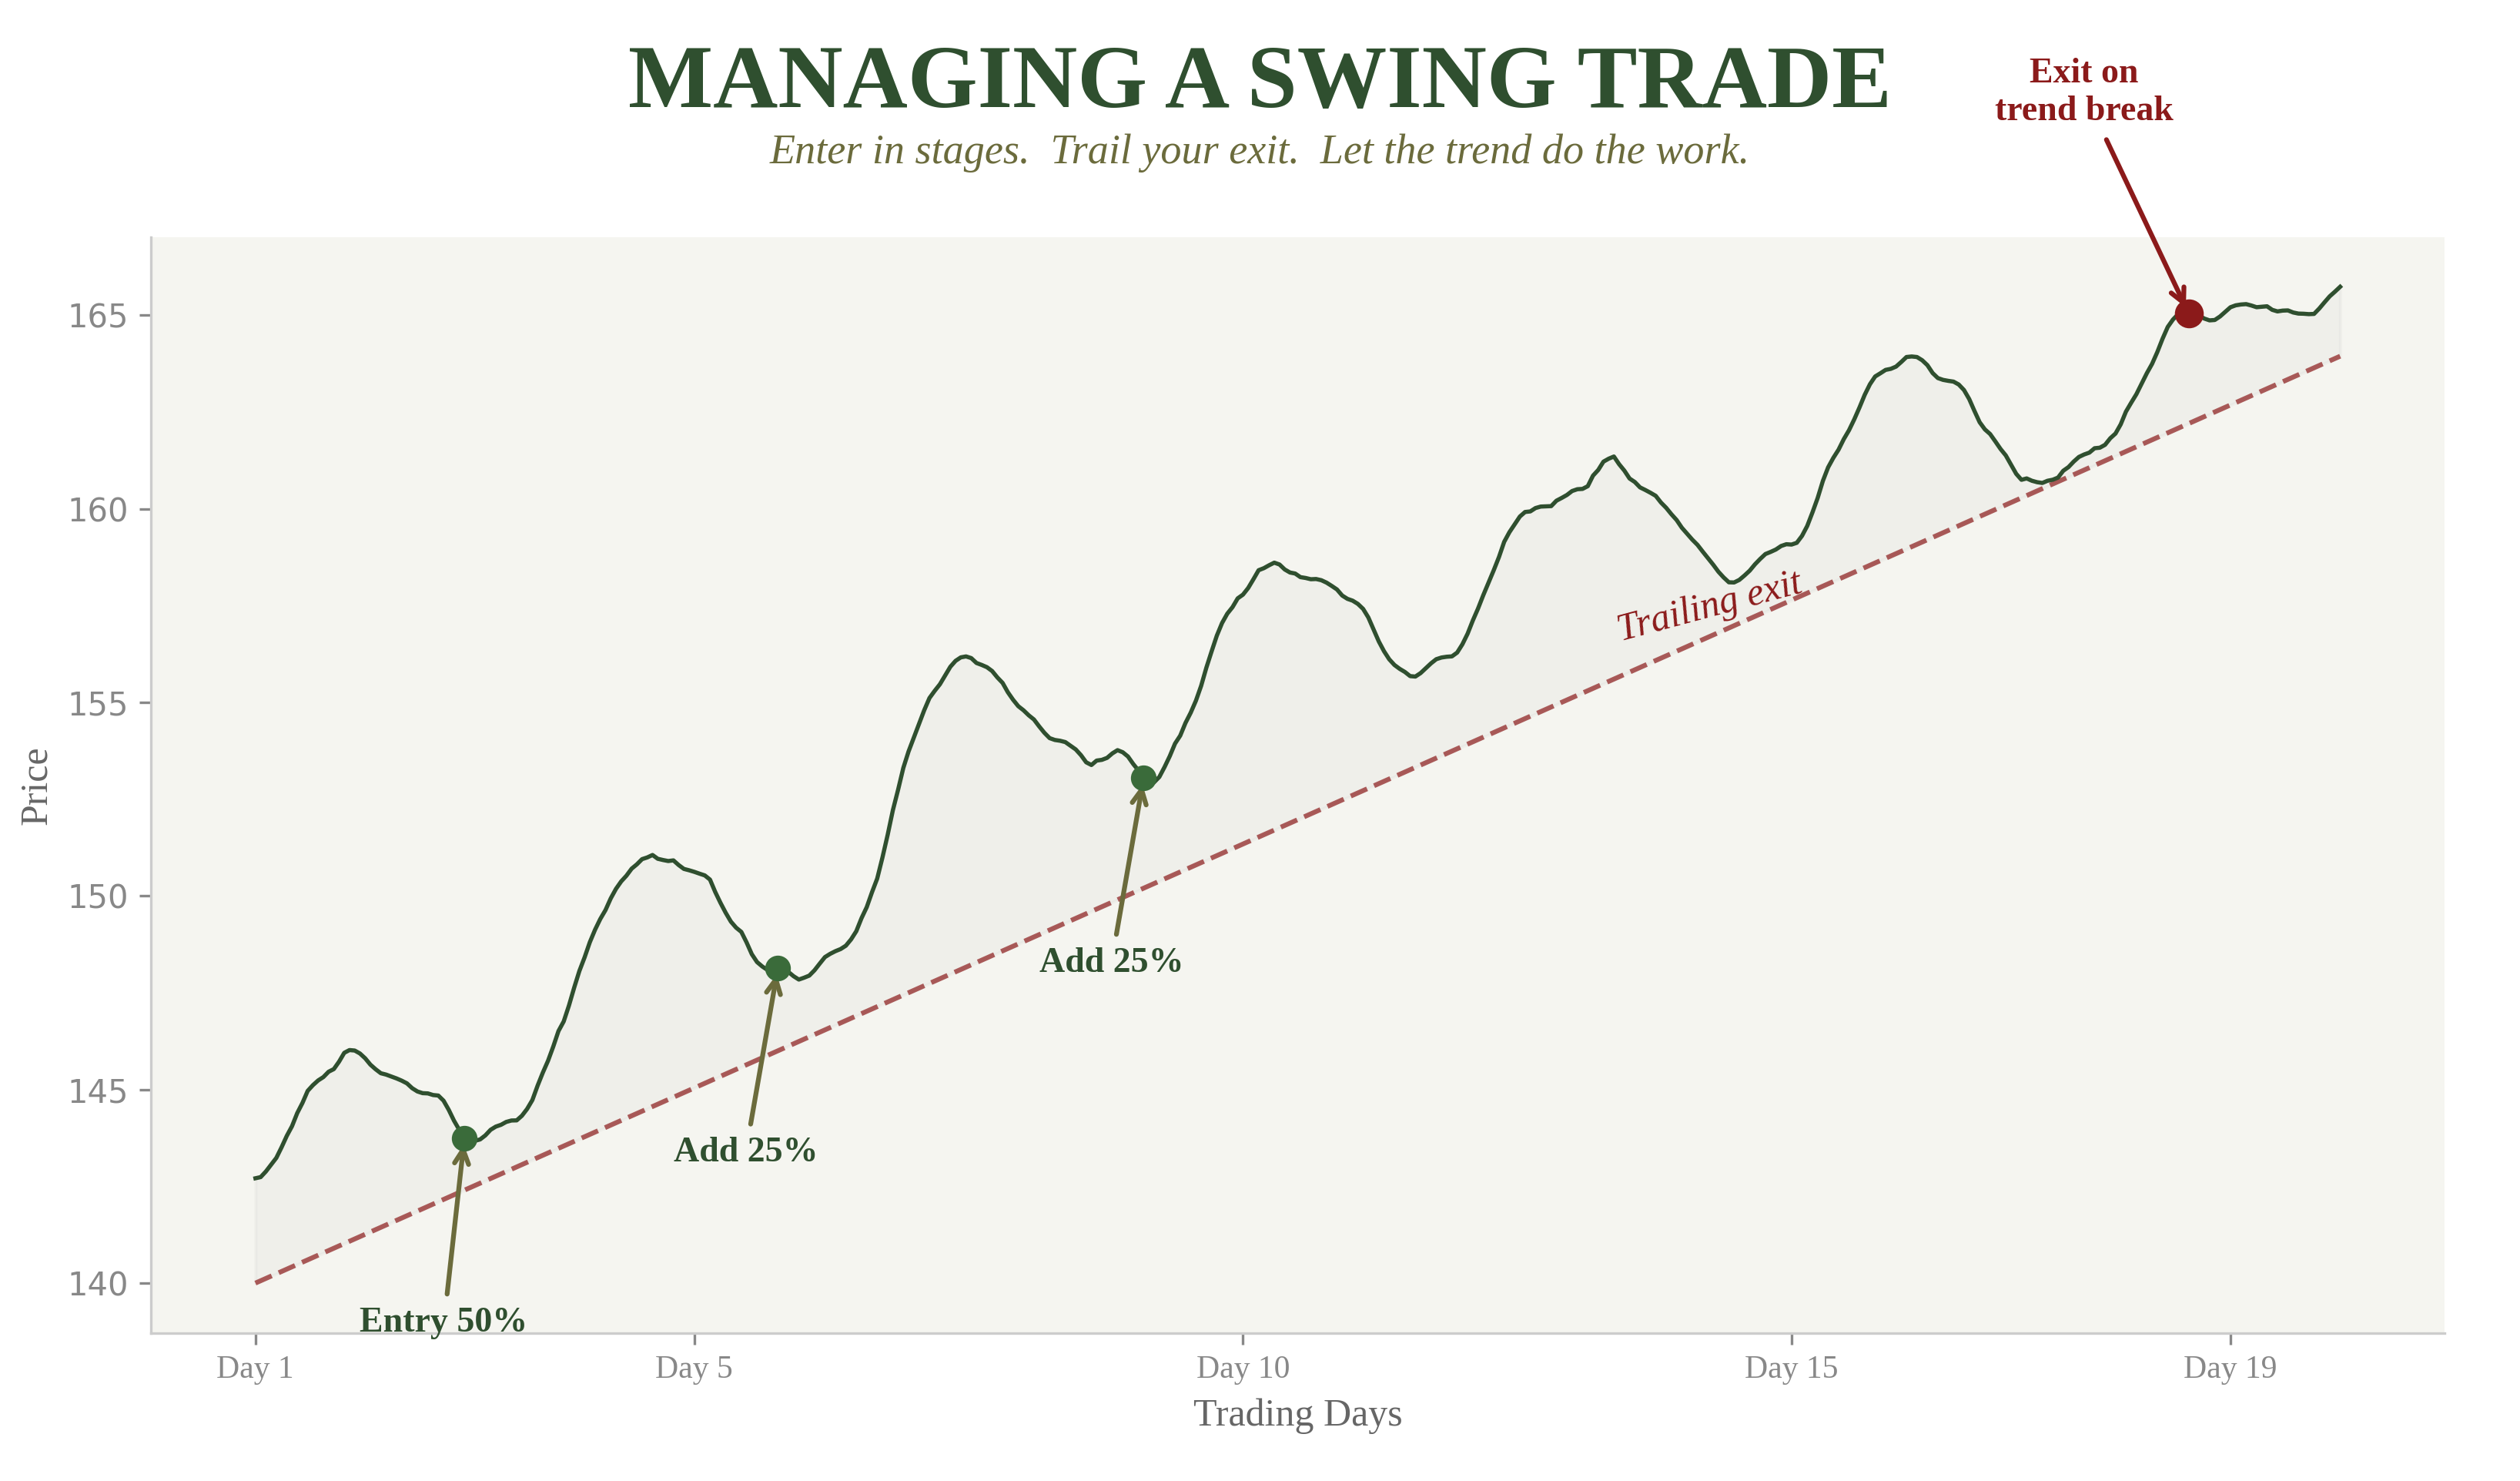
This is the unglamorous middle of the trade. The stock moves sideways or drifts slightly. You're checking your trades each morning, updating your exit, and looking for opportunities to add to the position.
A good Day 2 or Day 3 looks like this: the stock pulls back slightly from your entry, touches or approaches the new entry signal, and you add another 20–30% of your intended position. Your average cost is now slightly lower than your Day 1 entry. The grade is still A. You hold.
If you're anxious during Days 2–5, it usually means you haven't fully accepted the risk. Every trade involves discomfort. The question is whether you've pre-accepted that discomfort or whether it catches you off guard.
Research on trader behaviour confirms this: the most profitable traders are the ones who do the least during the middle of a trade. They set their orders and walk away. The least profitable traders fiddle constantly — adjusting stops, taking partial profits too early, adding at the wrong time.
Be boring. Boring is profitable.
Days 5–10: The Move Develops
If your setup is correct — macro supporting, trend intact, signal confirmed — the move typically starts to develop within the first week. The stock begins making new short-term highs. Volume picks up on the advances. The exit signal starts rising, reflecting the strengthening momentum.
During this phase, your daily routine is simple: check the new exit signal, update your sell limit order, confirm the grade is still A. If the exit has risen, you raise your sell limit. If it hasn't changed, you leave everything alone. The whole process takes under five minutes.
Taking Profits: The Art of the Trim
The exit signal has been reached. The stock hit your sell limit. Now what?
For Grade A trades, you don't sell everything at the first exit. You trim — sell 30–50% of the position and keep the rest running.
A Grade A trade hitting exit signals and still in an uptrend has a high probability of continuing. The macro is still supportive. The trend is intact. Why would you exit completely?
Trimming locks in a guaranteed gain and creates psychological freedom. The remaining position is "house money." Even if the stock reverses, you've already banked profit.
The Full Exit: When to Walk Away
When the macro changes, the grade changes. When the grade changes, you leave. Non-negotiable. The entire premise of holding without tight stops depends on the macro supporting you.
Higher highs and higher lows become lower highs and lower lows. The staircase reverses direction. The institutional money flow that was supporting the trend has changed.
An earnings disaster. A sudden geopolitical escalation. A surprise central bank announcement that shifts the regime. Rare but real. Don't wait for the morning signal — get out.
Notice what's not on the list: "I got bored." "I read a bearish article." "My friend says the market is overvalued." None of those are exit criteria. Your exit is driven by data — grades, trends, and signals — not by feelings.
Full Walkthrough: A 12-Day Swing Trade
Background: Regime 1. Semiconductor stock in a clean uptrend. Grade A setup: entry at 142.00, exit at 151.50.
Stock dips to 142.00. Buy limit fills. 200 shares (40% position). Bounces to 143.20 close.
200 shares at 142.00Dips to 141.80, doesn't reach 141.50. Don't chase. Closes 142.60. Sideways. Grade A intact.
No fill — patienceSector selling on competitor's weak guidance. Stock drops to 141.00. Add order fills. 150 more shares. Total: 350 at ~141.60 avg. Closes 141.30. Underwater. Grade still A.
350 shares — adding on dipFlat at 141.50. Tight range. Boring. Perfect. Add final 50 shares. Total: 400 shares at ~141.55 avg.
400 shares — full positionOpens 142.50, pushes to 144.80 on strong volume. Sector catching a bid. Closes 144.50.
Momentum buildingPushes to 147.50, closes 146.90. Up over £2,100. Temptation to take profit. Grade A. Hold.
+£2,100 unrealised — holdingQuiet. 146.00–147.80. Closes 147.20. Nothing to do.
Quiet dayPushes to 149.50. Strong session. Up ~£3,180.
+£3,180 — trend acceleratingGaps up on customer earnings. Pushes to 154.20 — 30p from exit. Closes 153.80. So close.
Missed exit by 30pExit jumps to 158. Stock hits 156.80. Trim: sell 150 shares at 156.80. Profit: ~£2,280 banked. Holding 250.
Trimmed 150 shares — £2,280 bankedTouches 159.30 — close. Pulls back to 157.80. Hold.
Almost therePushes through 160.00 in morning session. Sell limit fills. Exit remaining 250 shares.
Final exit at 160.00 — trade complete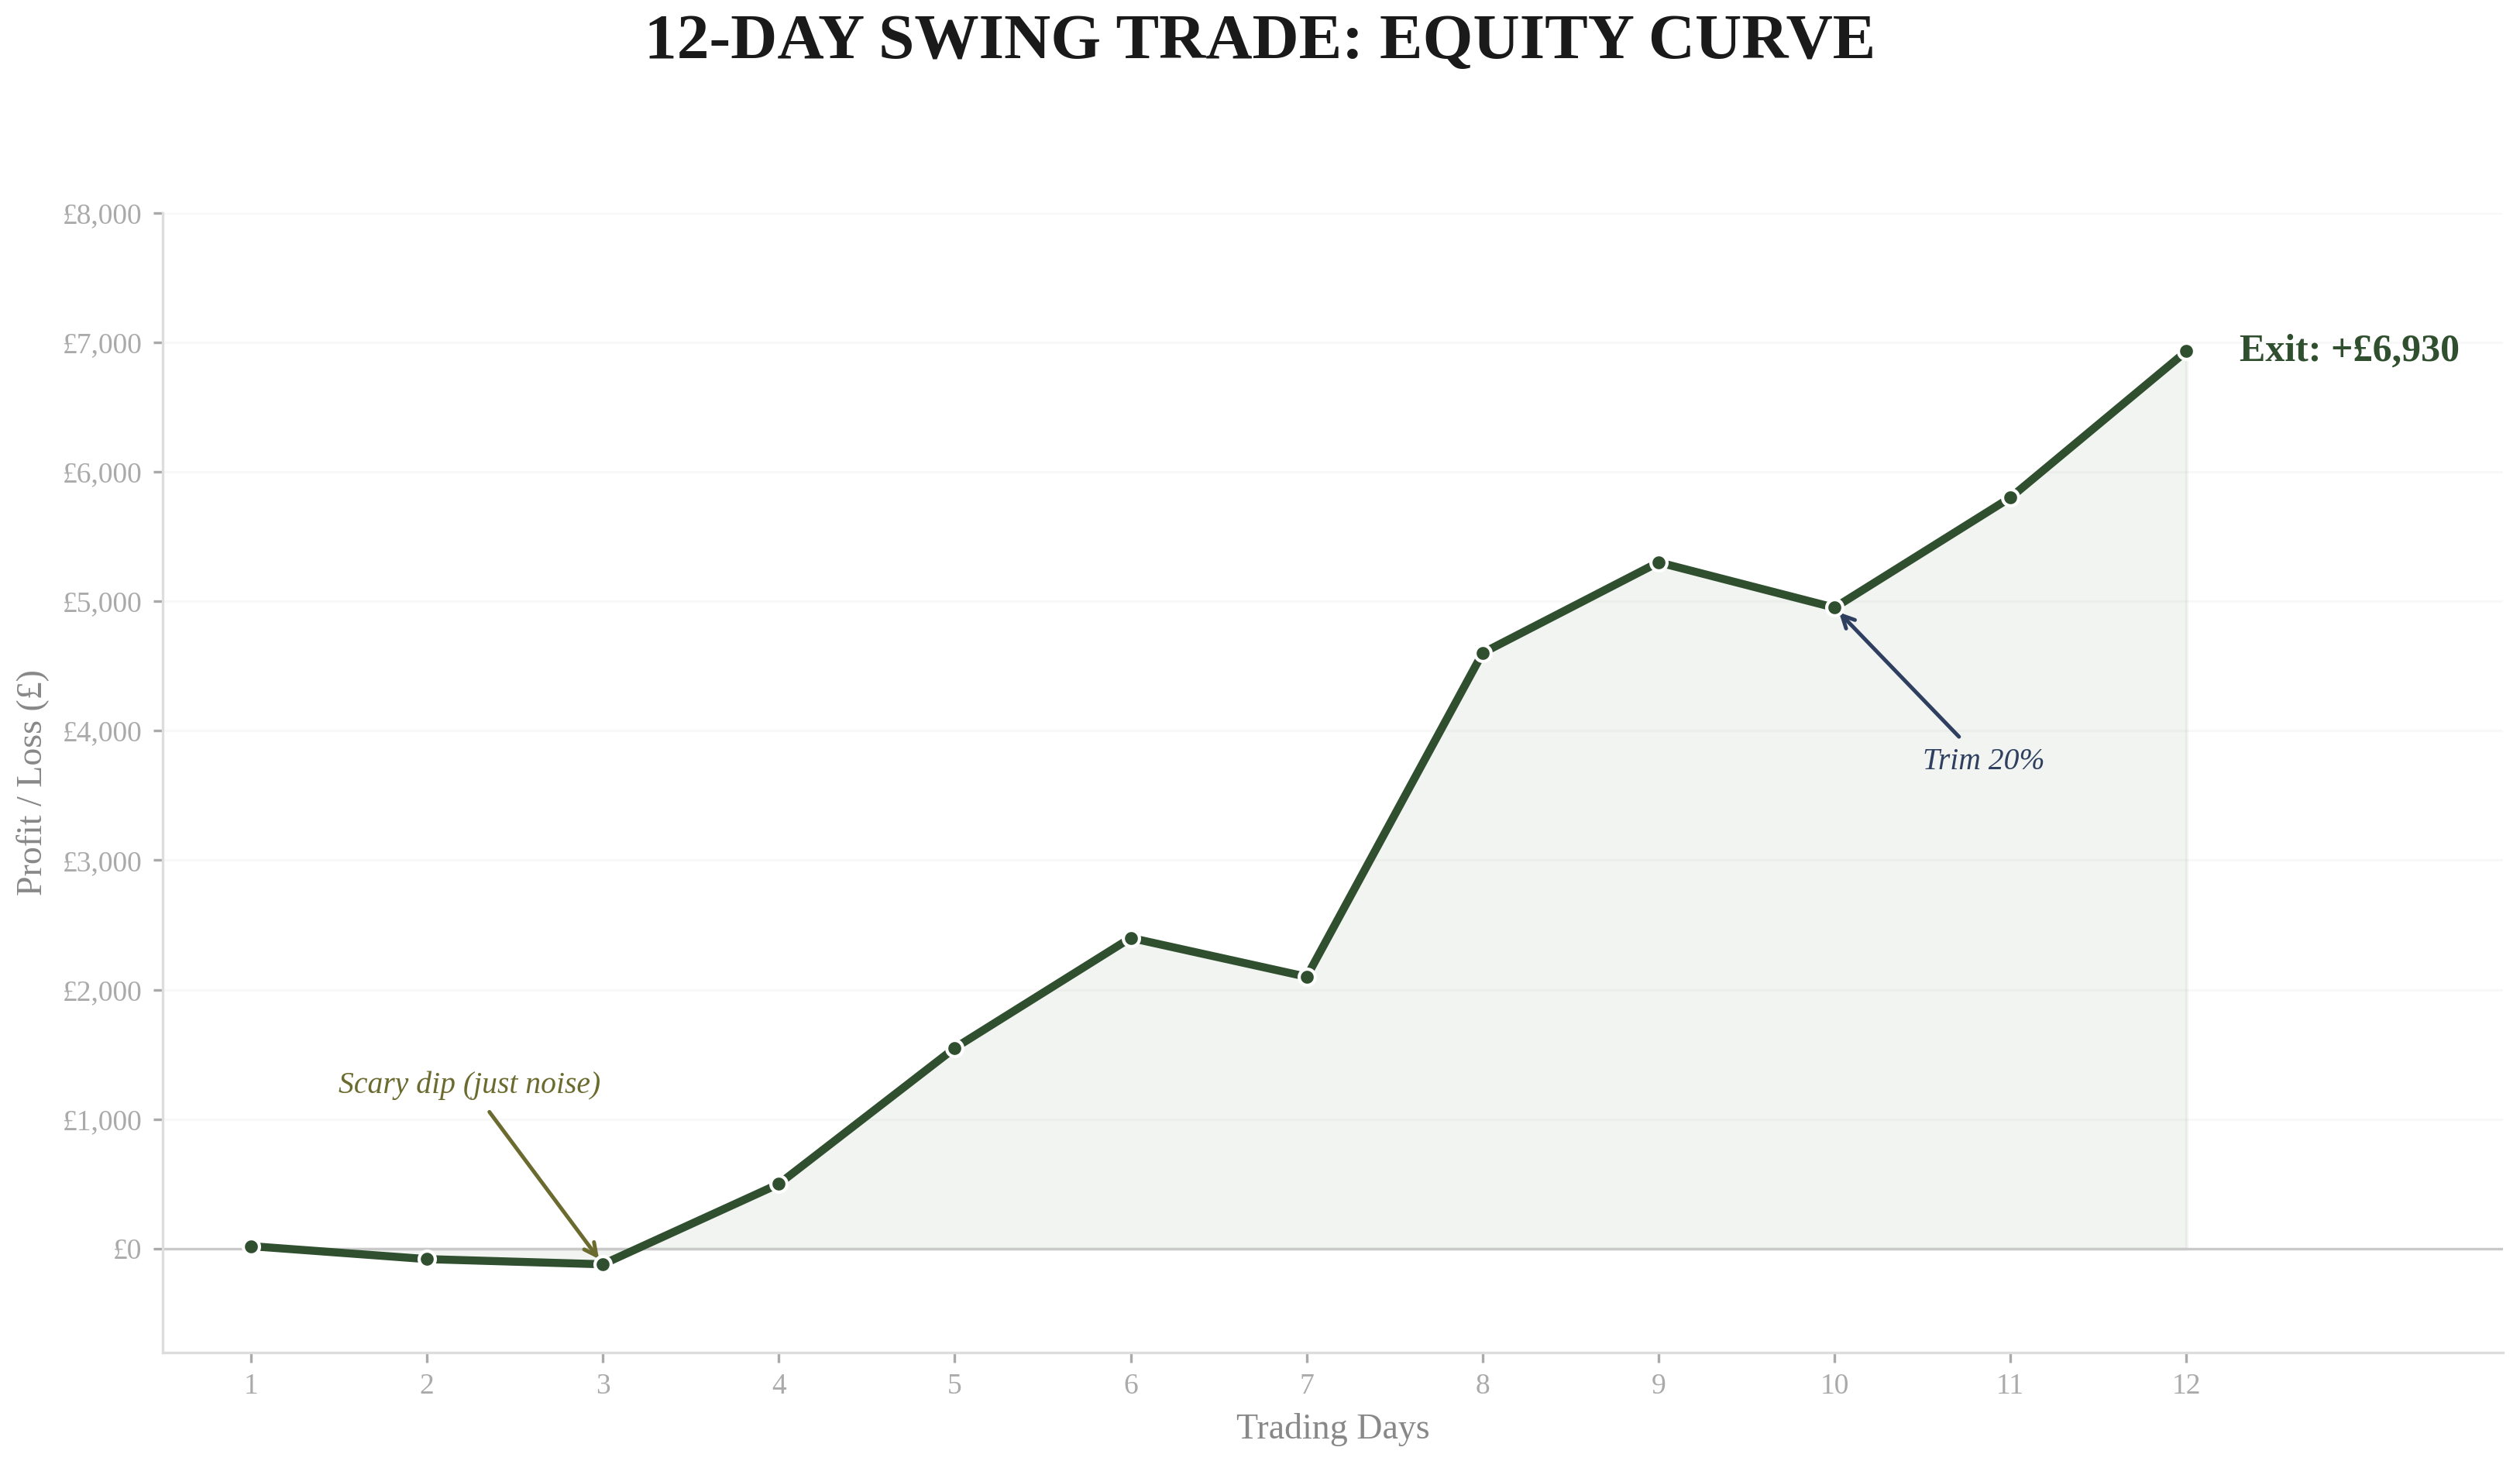
Nearly £7,000 in profit over twelve trading days, spending fifteen to twenty minutes per morning. The hardest part of the entire trade was Day 3. Everything else was routine: check signals, update orders, move on with your life.
Handling the Unexpected
Earnings Surprise (Positive)
Your stock gaps up 8% the next morning. The grade is still A. The exit signal has jumped dramatically. This is a gift. Trim a portion to lock in the windfall and let the rest ride. Don't sell everything just because the gain happened fast.
Earnings Surprise (Negative)
Your stock gaps down 12% overnight. The grade has been downgraded to C. You sell at the open. No hesitation. Don't wait for it to "bounce back." Don't average down. The thesis is broken. The grade tells you to leave.
A 12% gap down, if sized correctly (1–2% of portfolio at risk), hurts but doesn't cripple you. That's why position sizing exists.
Market-Wide Selloff
The whole market drops 3% on a surprise event. Before doing anything, ask two questions: has the macro regime changed? Has the grade changed?
In August 2024, the market dropped sharply on recession fears. Traders with a system checked their regime analysis. Growth was still expanding. Inflation still cooling. Earnings still growing. The regime hadn't changed. Traders who held their Grade A positions — or added to them during the dip — recovered everything within days.
The Trading Journal
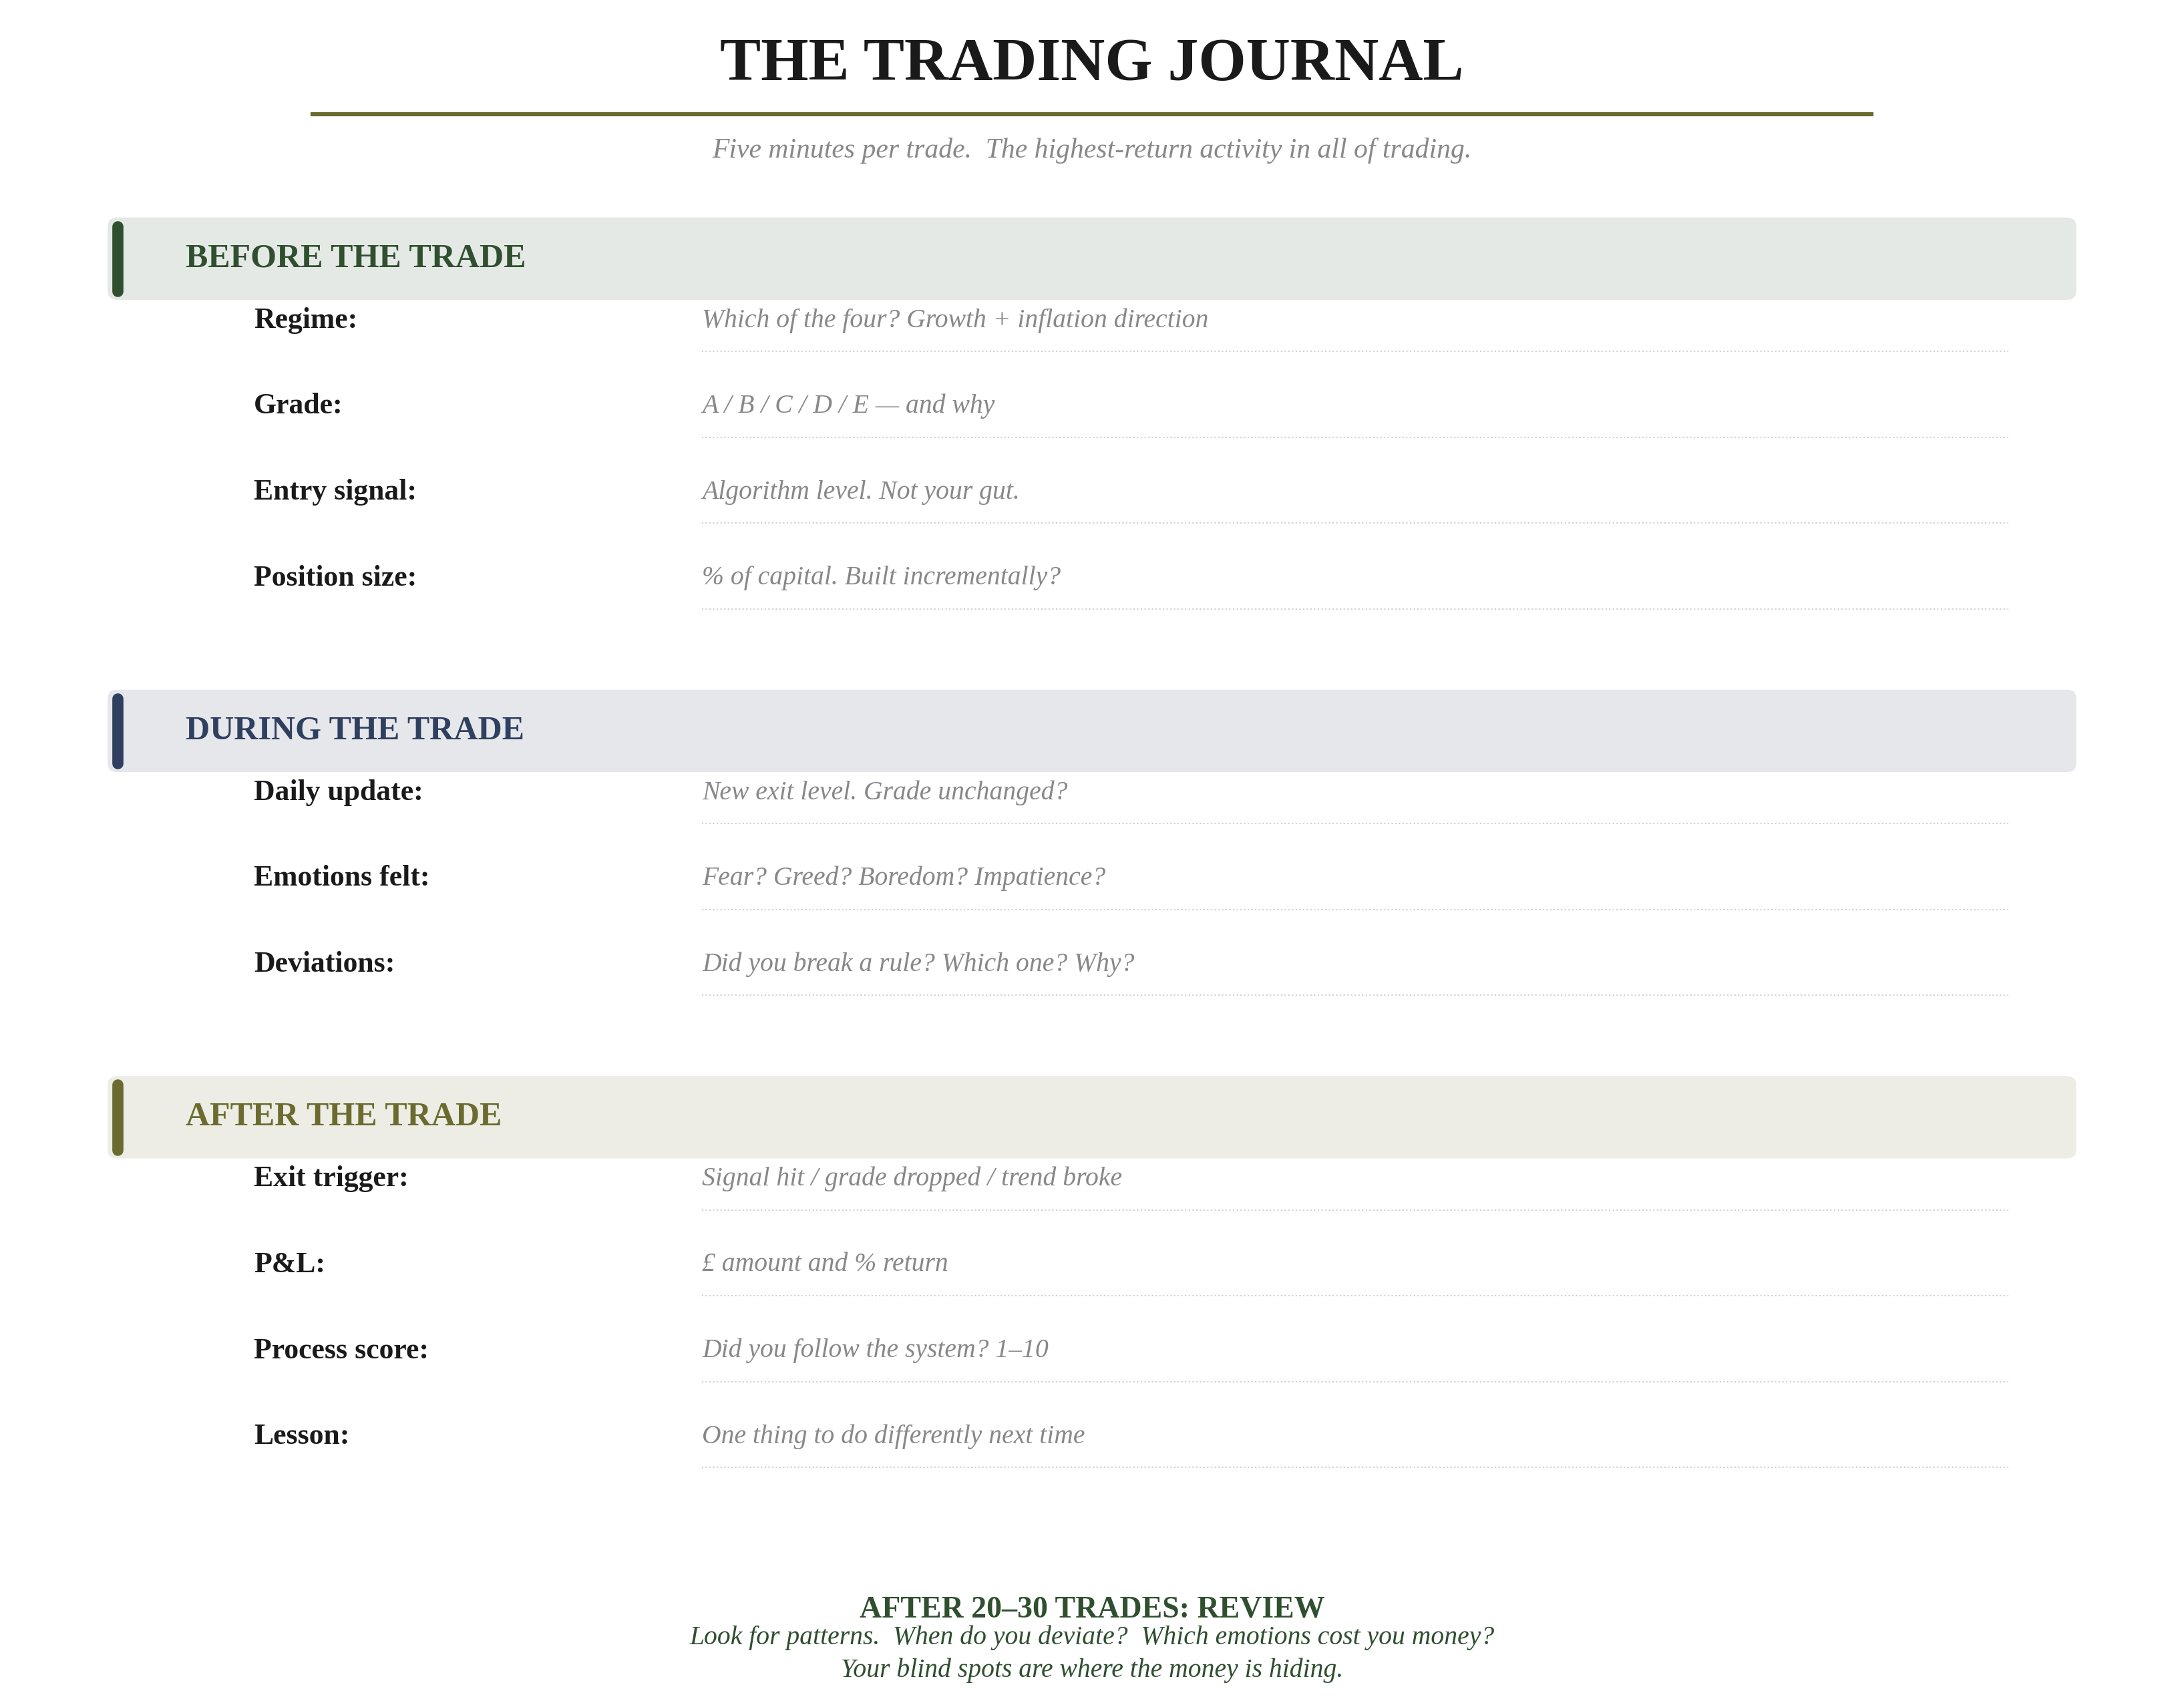
After every trade, record:
The setup: What was the regime? What was the grade? What was the entry signal? Why did you take this trade?
The management: Did you build incrementally? Did you update exits daily? Did you follow the grade changes?
The outcome: What was the profit or loss? Where did you exit? Was it at the setup, or did you deviate?
The deviation: If you deviated from the system — exited early, added too much, held through a downgrade — why? What were you feeling?
After 20–30 trades, review the journal. You'll see patterns that are invisible in real time. The journal reveals your blind spots — and your blind spots are where the money is hiding.
The Swing Trader's Routine
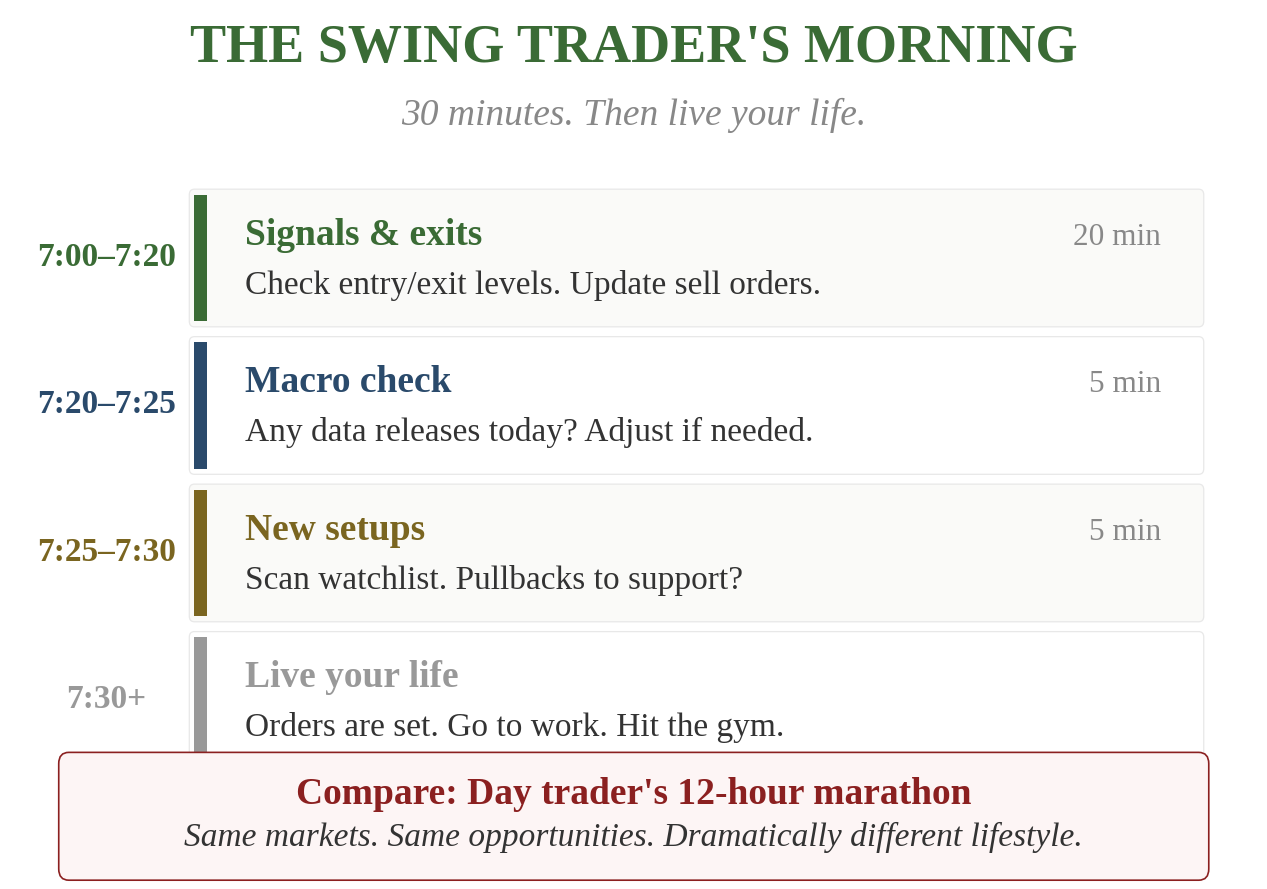
7:00–7:20am: Coffee and signals. Check entry/exit levels. Update limit orders. Check grade changes. (Want these delivered to you daily? Try it free for 7 days.)
7:20–7:25am: Quick macro check. Any major data releases? Central bank speeches?
7:25–7:30am: Scan for new trades. Any new pullbacks to support in uptrending stocks?
7:30am onwards: Live your life. The orders are set. The market will do what it does.
Swing trading isn't the lazy approach. It's the smart approach. Every hour you're not watching the market is an hour you're not tempted to override your system. And your system, left alone to do its job, will outperform your interventions almost every time. See what that disciplined approach delivers over time on our verified performance page.
Part Three complete. Next: Part Four — Day Trading. The hardest way to trade, and the truth nobody tells you.
- 1.The first days are boring by design — boring is profitable. Resist the urge to "do something."
- 2.Trim 30-50% at the first exit signal and let the rest ride — this locks in profit and creates psychological freedom.
- 3.Three exit triggers only: grade downgrade, trend break, or significant event. Nothing else justifies selling.
This content is for educational purposes only and does not constitute investment advice. Trading and investing involve substantial risk of loss. Past performance is not indicative of future results. Always do your own research and consider seeking professional guidance before making financial decisions.