Most people think they know how stock prices move. A company reports good earnings, the stock goes up. Bad news comes out, the stock goes down. Supply and demand. Simple.
That's the children's version. The real version is darker, faster, and more adversarial than most traders ever realise. What moves the price of a stock in the next five minutes has almost nothing to do with earnings, news, or fundamentals. It has everything to do with who is placing orders, how large those orders are, and which direction the institutional money is flowing.
The chart is a summary — like looking at the final score of a football match without seeing any of the plays. Market microstructure is the plays.
The Order Book
Every traded instrument has an order book — a live, constantly updating list of all the buy orders (bids) and sell orders (asks) sitting in the market at any given moment. This is the heartbeat of price discovery.
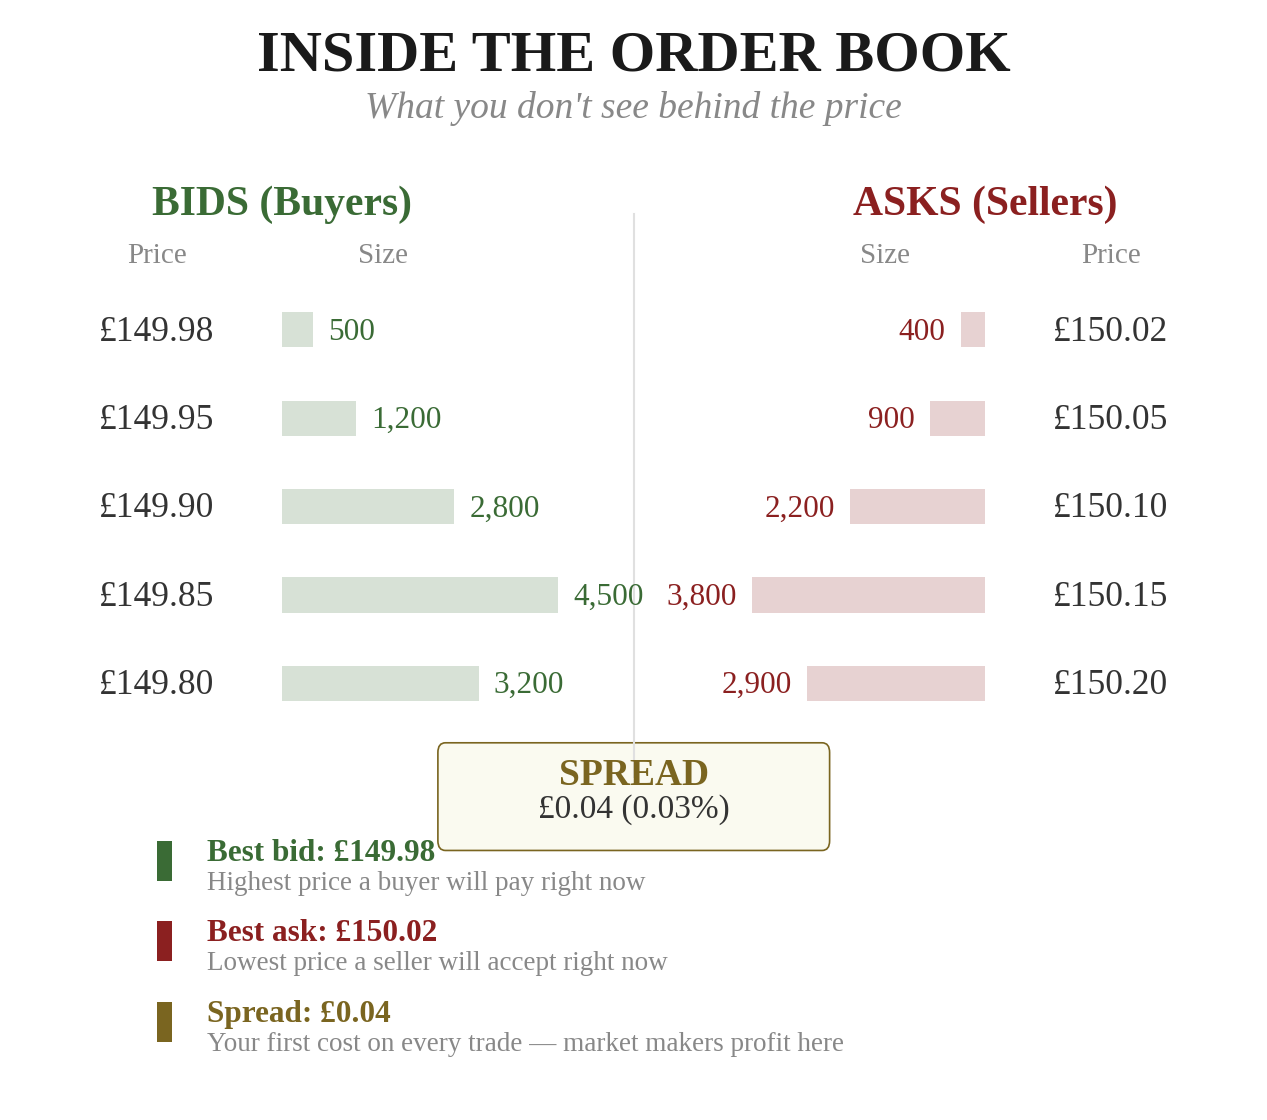
The left side shows buyers willing to pay various prices. The right side shows sellers willing to accept various prices. The gap between the highest bid and the lowest ask is called the spread. This spread is a cost you pay every time you trade — and it goes straight into the market maker's pocket.
The price moves when one side overwhelms the other. If a large buyer comes in and buys all the shares at the ask, then the advanced, then the next — the stock has moved up. Not because of earnings, or news, or macro data. Because someone placed a large order that consumed the available supply.
This is what day traders are really trading: the imbalances in the order book.
Market Makers and Liquidity
Market makers are firms that continuously post bids and asks in the order book, providing liquidity. They're willing to buy from you at the bid and sell to you at the ask, pocketing the spread as profit. In exchange, they keep the market functioning smoothly.
They actively manage their inventory. If a market maker has accumulated too many shares, they'll lower their bid to discourage more selling and raise their ask to encourage buying. If they've sold too many shares short, they'll do the opposite. This constant inventory management creates subtle price oscillations that are invisible on a daily chart but dominate the 1-minute chart.
Market makers are constantly pushing price back toward equilibrium. If the price moves too far, too fast, they widen their spreads (increasing your costs) and reduce their size (providing less liquidity). This is why the fastest, most volatile moves are also the most expensive to trade.
In 2010, during the Flash Crash, market makers pulled their orders entirely. Liquidity vanished. Prices fell 9% in minutes before bouncing back. Major stocks briefly traded at pennies. Stop-loss orders triggered at absurd prices.
When you most need liquidity (during a sharp move), it tends to disappear. This catches day traders constantly.
Order Flow: Reading the Tape
Order flow is the study of actual transactions — the sequence of trades happening in real time. Professional day traders call it "reading the tape." The technology has changed. The skill hasn't.
When you read order flow, you're looking at three things:
Size. How large are the individual trades? A burst of 50-share trades hitting the ask is noise — retail traders buying in small lots. A single 10,000-share trade hitting the ask is signal — an institution making a move.
Aggression. Are buyers lifting the ask (paying the higher price) or are sellers hitting the bid (accepting the lower price)? Aggressive buyers repeatedly paying the ask is genuine demand. Passive buyers posting bids and waiting means low urgency.
Sequence. What happens after a large order? If a 10,000-share buy is immediately followed by the price drifting back down, the market absorbed it easily. If the price continues higher on additional buying, there's genuine institutional momentum.
Two traders watching the same stock at 10:15am. Both see price break above 150.00 — a round number that's been resistance all morning. Both charts look identical.
Trader One looks at the chart and buys. "Breakout above resistance." She's trading a pattern.
Trader Two looks at the order flow. The breakout was driven entirely by small 100–200 share orders. No institutional blocks. The 3,000 shares on the ask at 150.05 haven't been touched. And below the surface, a hidden bid keeps refreshing at 149.80 — someone is accumulating on dips.
Fifteen minutes later, the stock falls back below 150.00. The retail breakout failed. Trader One is stopped out.
Then at 10:45am: three institutional blocks — 8,000, 12,000, and 6,000 shares — hit the ask in rapid succession. The sell wall at 150.05 evaporates. Volume spikes. That is the real breakout. Trader Two buys.
Volume Profile and VWAP
Shows where the most trading activity has occurred at each price level. The price with the most volume is the Point of Control — fair value that the market has most heavily agreed upon. Prices tend to gravitate back toward it, and when they break away convincingly, it signals a shift in sentiment.
The average price paid for all shares traded during the day, weighted by volume. It's the single most important benchmark in professional day trading because it's how institutional traders measure execution quality.
Institutional algorithms are programmed to buy below VWAP and sell above it. This creates predictable dynamics: below VWAP, algo buying pushes price up. Above VWAP, algo selling pushes price down. VWAP acts as an intraday magnet.
A stock that opens below VWAP and pushes above it is showing genuine strength — buyers are overcoming institutional selling. A stock that opens above VWAP and falls below it is showing weakness. These VWAP crosses are among the most reliable intraday signals. Our market products incorporate volume analysis like this across all six markets.
Dark Pools and Hidden Liquidity
A significant percentage of trading volume — estimated at 40–50% — doesn't happen on the public exchanges. It happens in dark pools: private trading venues where large institutional orders can be filled without showing up in the visible order book.
The order book you're reading is incomplete. You can see 3,500 shares on the bid at £100.00 and believe there's strong support. But a dark pool might have 50,000 shares of hidden selling waiting at £100.01. The visible support is an illusion. The real supply is invisible.
There's no way to see dark pool orders before they execute. Institutions know what's in the dark pools because they're the ones placing orders there. You don't.
You're watching a stock hold support at £75.00 for the fourth time. The visible bid is thick. You buy at £75.10, confident the support will hold.
What you can't see: a pension fund has a dark pool order to sell 500,000 shares at £75.05. The moment price touches £75.05, the dark order starts filling. The visible bid at £75.00 evaporates in seconds. The stock drops to £74.20.
Your "safe" support-based entry is now a 1.2% loss.
The Iceberg and the Spoofing
Large orders that only show a small portion to the public. An institution might have 100,000 shares to buy, but they display only 500 at a time. Every time their displayed 500 are filled, another 500 appear. If you're watching the book, you'll see the same bid size keep refreshing at the same price — that's the iceberg showing its tip while hiding its mass.
Placement of large orders with no intention of executing. A trader places a 50,000-share bid at £99.90 to create the appearance of strong support, then cancels it the moment price approaches. The purpose: trick other participants into thinking there's demand, then sell to them at a higher price.
Spoofing is illegal, but enforcement is difficult and it still happens regularly.
A day trader sees a 40,000-share bid appear at £148.00 on a stock trading at £148.20. "That's massive support," he thinks. He buys at £148.15, confident the floor is there.
The stock dips to £148.05. The 40,000-share bid vanishes — cancelled instantly. It was never real. The stock drops to £147.50. The "support" was a mirage designed to lure buyers exactly like him.
The order book is not a transparent window into supply and demand. It's a game of deception played by sophisticated participants.
Some orders are real. Some are icebergs showing a fraction of their true size. Some are spoofs designed to manipulate. And 40–50% of the real trading isn't visible at all. If you're going to day trade, this is the game you're playing. Make sure you understand it before you sit down at the table. Explore our free research tools to build a stronger analytical foundation.
Now that you understand the hidden mechanics, the next chapter covers the practical tools and techniques that professional day traders use to navigate this landscape.
- 1.The order book is a game of deception — iceberg orders hide size, spoofing creates fake support, and 40-50% of volume is in dark pools you can't see.
- 2.VWAP is the most important intraday benchmark — institutional algorithms buy below it and sell above it.
- 3.Understanding market microstructure gives you an edge even if you trade on longer timeframes.
This content is for educational purposes only and does not constitute investment advice. Trading and investing involve substantial risk of loss. Past performance is not indicative of future results. Always do your own research and consider seeking professional guidance before making financial decisions.