If price is the only honest voice in the room, then charts are how it speaks. A chart is simply price plotted over time. Nothing more, nothing less. But within that simple picture, there's an enormous amount of information — if you know how to read it.
This isn't going to be an encyclopaedia of every chart pattern ever invented. Most of that stuff is noise. Instead, we're going to focus on the few things that actually matter — the signals that have real predictive value and that feed directly into the grading system.
Trends: The Only Thing That Pays You
A trend is the single most important concept in technical analysis. It is the only pattern that consistently makes money. Everything else — double tops, head and shoulders, cup and handles, Fibonacci retracements — is secondary. If you understand trends, you can trade profitably and ignore 90% of what technical analysis textbooks teach you.
Saw the stock was "up a lot" and decided it must be due for a correction. Shorted it. Added to the short as it went higher. Eventually forced to cover at a much higher price.
Saw the uptrend — higher highs, higher lows. Waited for a pullback to support, bought, and rode the next leg higher.
Same stock. Same chart. Same information. One made money, one lost money. The only difference was whether they traded with or against the trend.
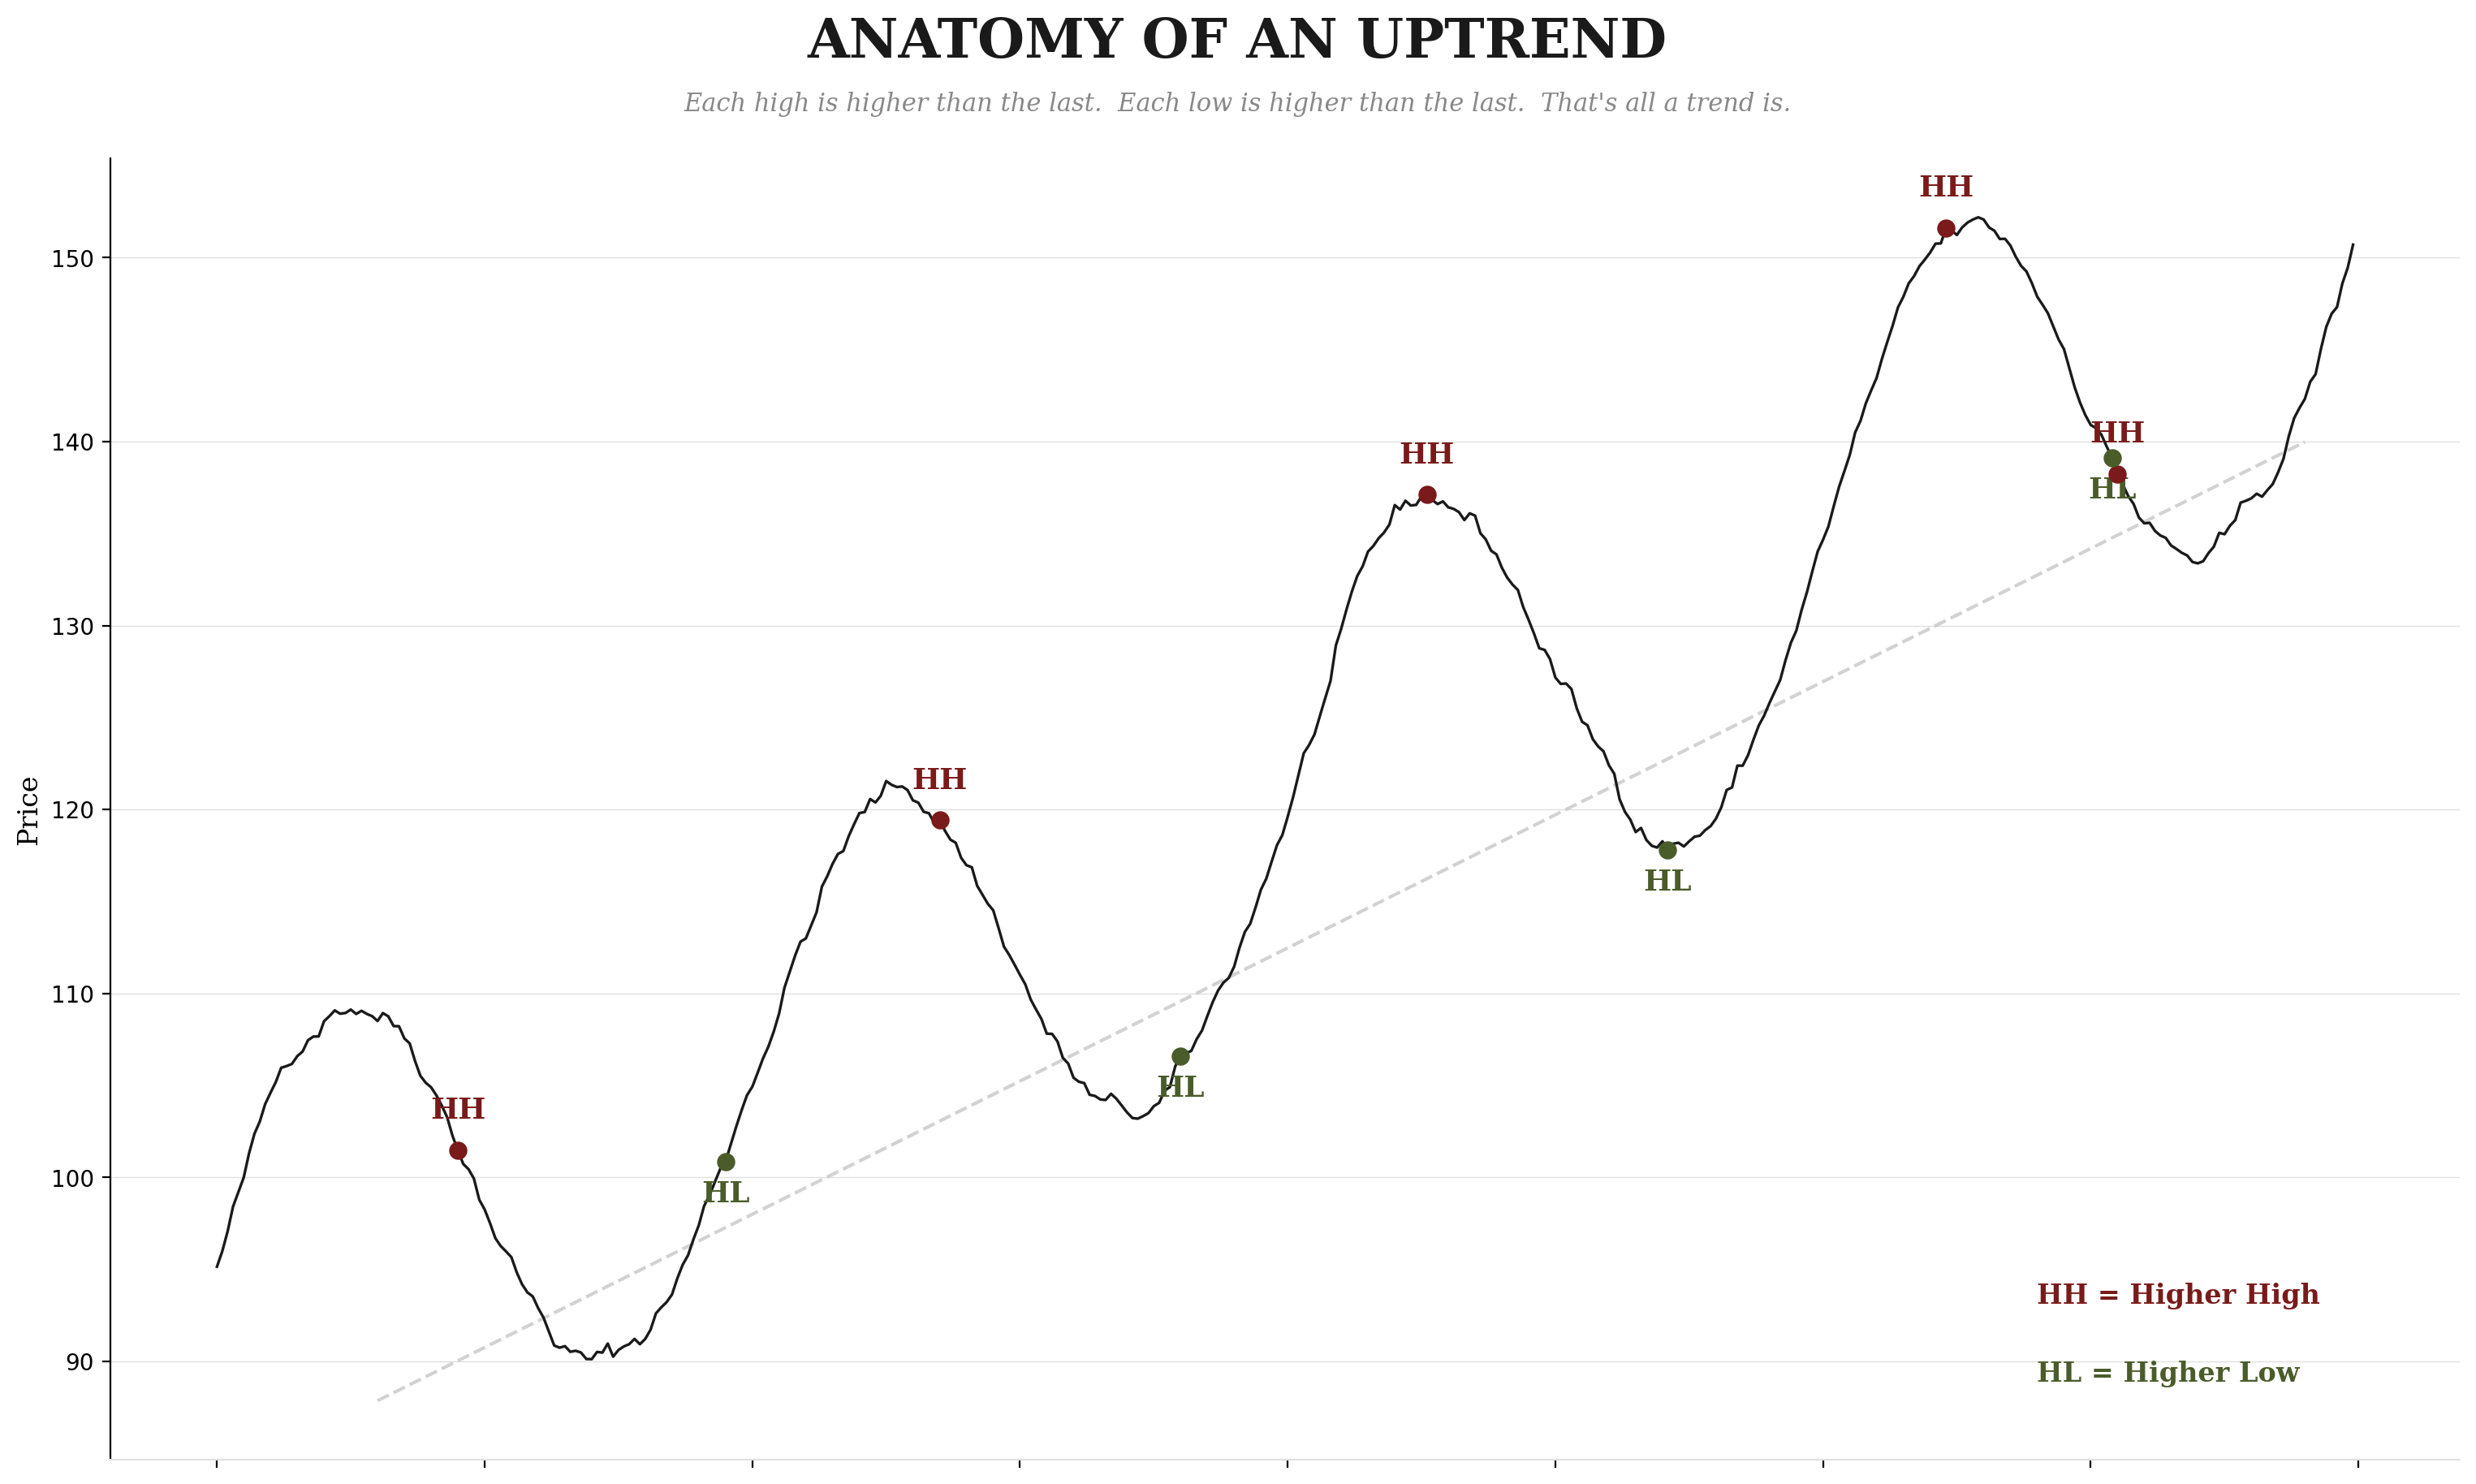
A trend is defined by two simple rules:
A series of higher highs and higher lows. Each peak is higher than the last. Each pullback holds above the previous low. Price moves up like a staircase.
A series of lower highs and lower lows. Each rally fails below the last peak. Each decline cuts below the previous low. The staircase goes down.
That's it. Higher highs and higher lows means up. Lower highs and lower lows means down. If the price isn't doing either, it's in a range — and ranges are usually where you wait, not where you trade.
Why Trends Exist
Trends aren't random. They're not patterns that exist because of astrology or market mysticism. They exist because of how money actually flows through markets. And once you understand this, you'll never fight a trend again.
When a large institution — a pension fund, a sovereign wealth fund, a major hedge fund — decides to buy a stock, they can't buy it all at once. Imagine a fund that needs to accumulate $500 million worth of a single stock. If they dropped a $500 million buy order into the market, they'd move the price against themselves so violently that they'd end up buying most of their shares at inflated prices.
So they buy in pieces. Quietly. A little today. A little tomorrow. A little next week. They use algorithms to disguise their buying, slicing it into thousands of small orders spread across days or weeks. But they can't hide the effect on price. Each day they buy, they put upward pressure on the price. The chart shows higher lows as their buying absorbs every dip.
And here's the key: they're not done after one week. A $500 million position might take a month or two to build. That's a month or two of consistent buying pressure. A month or two of uptrend. By the time you see the trend on a chart, the institutional buying is already well underway — and it might have weeks more to run.
When you short a stock in an uptrend, you're fighting against institutional money flow that may continue for weeks or months. You're a person with a bucket trying to hold back a river.
The trend tells you which way the big money is moving. Your job is to move with it, not against it.
Support and Resistance
After trends, the next most useful concept is support and resistance. These are price levels where buying or selling tends to cluster — and they're the reason certain numbers on a chart seem to matter more than others.
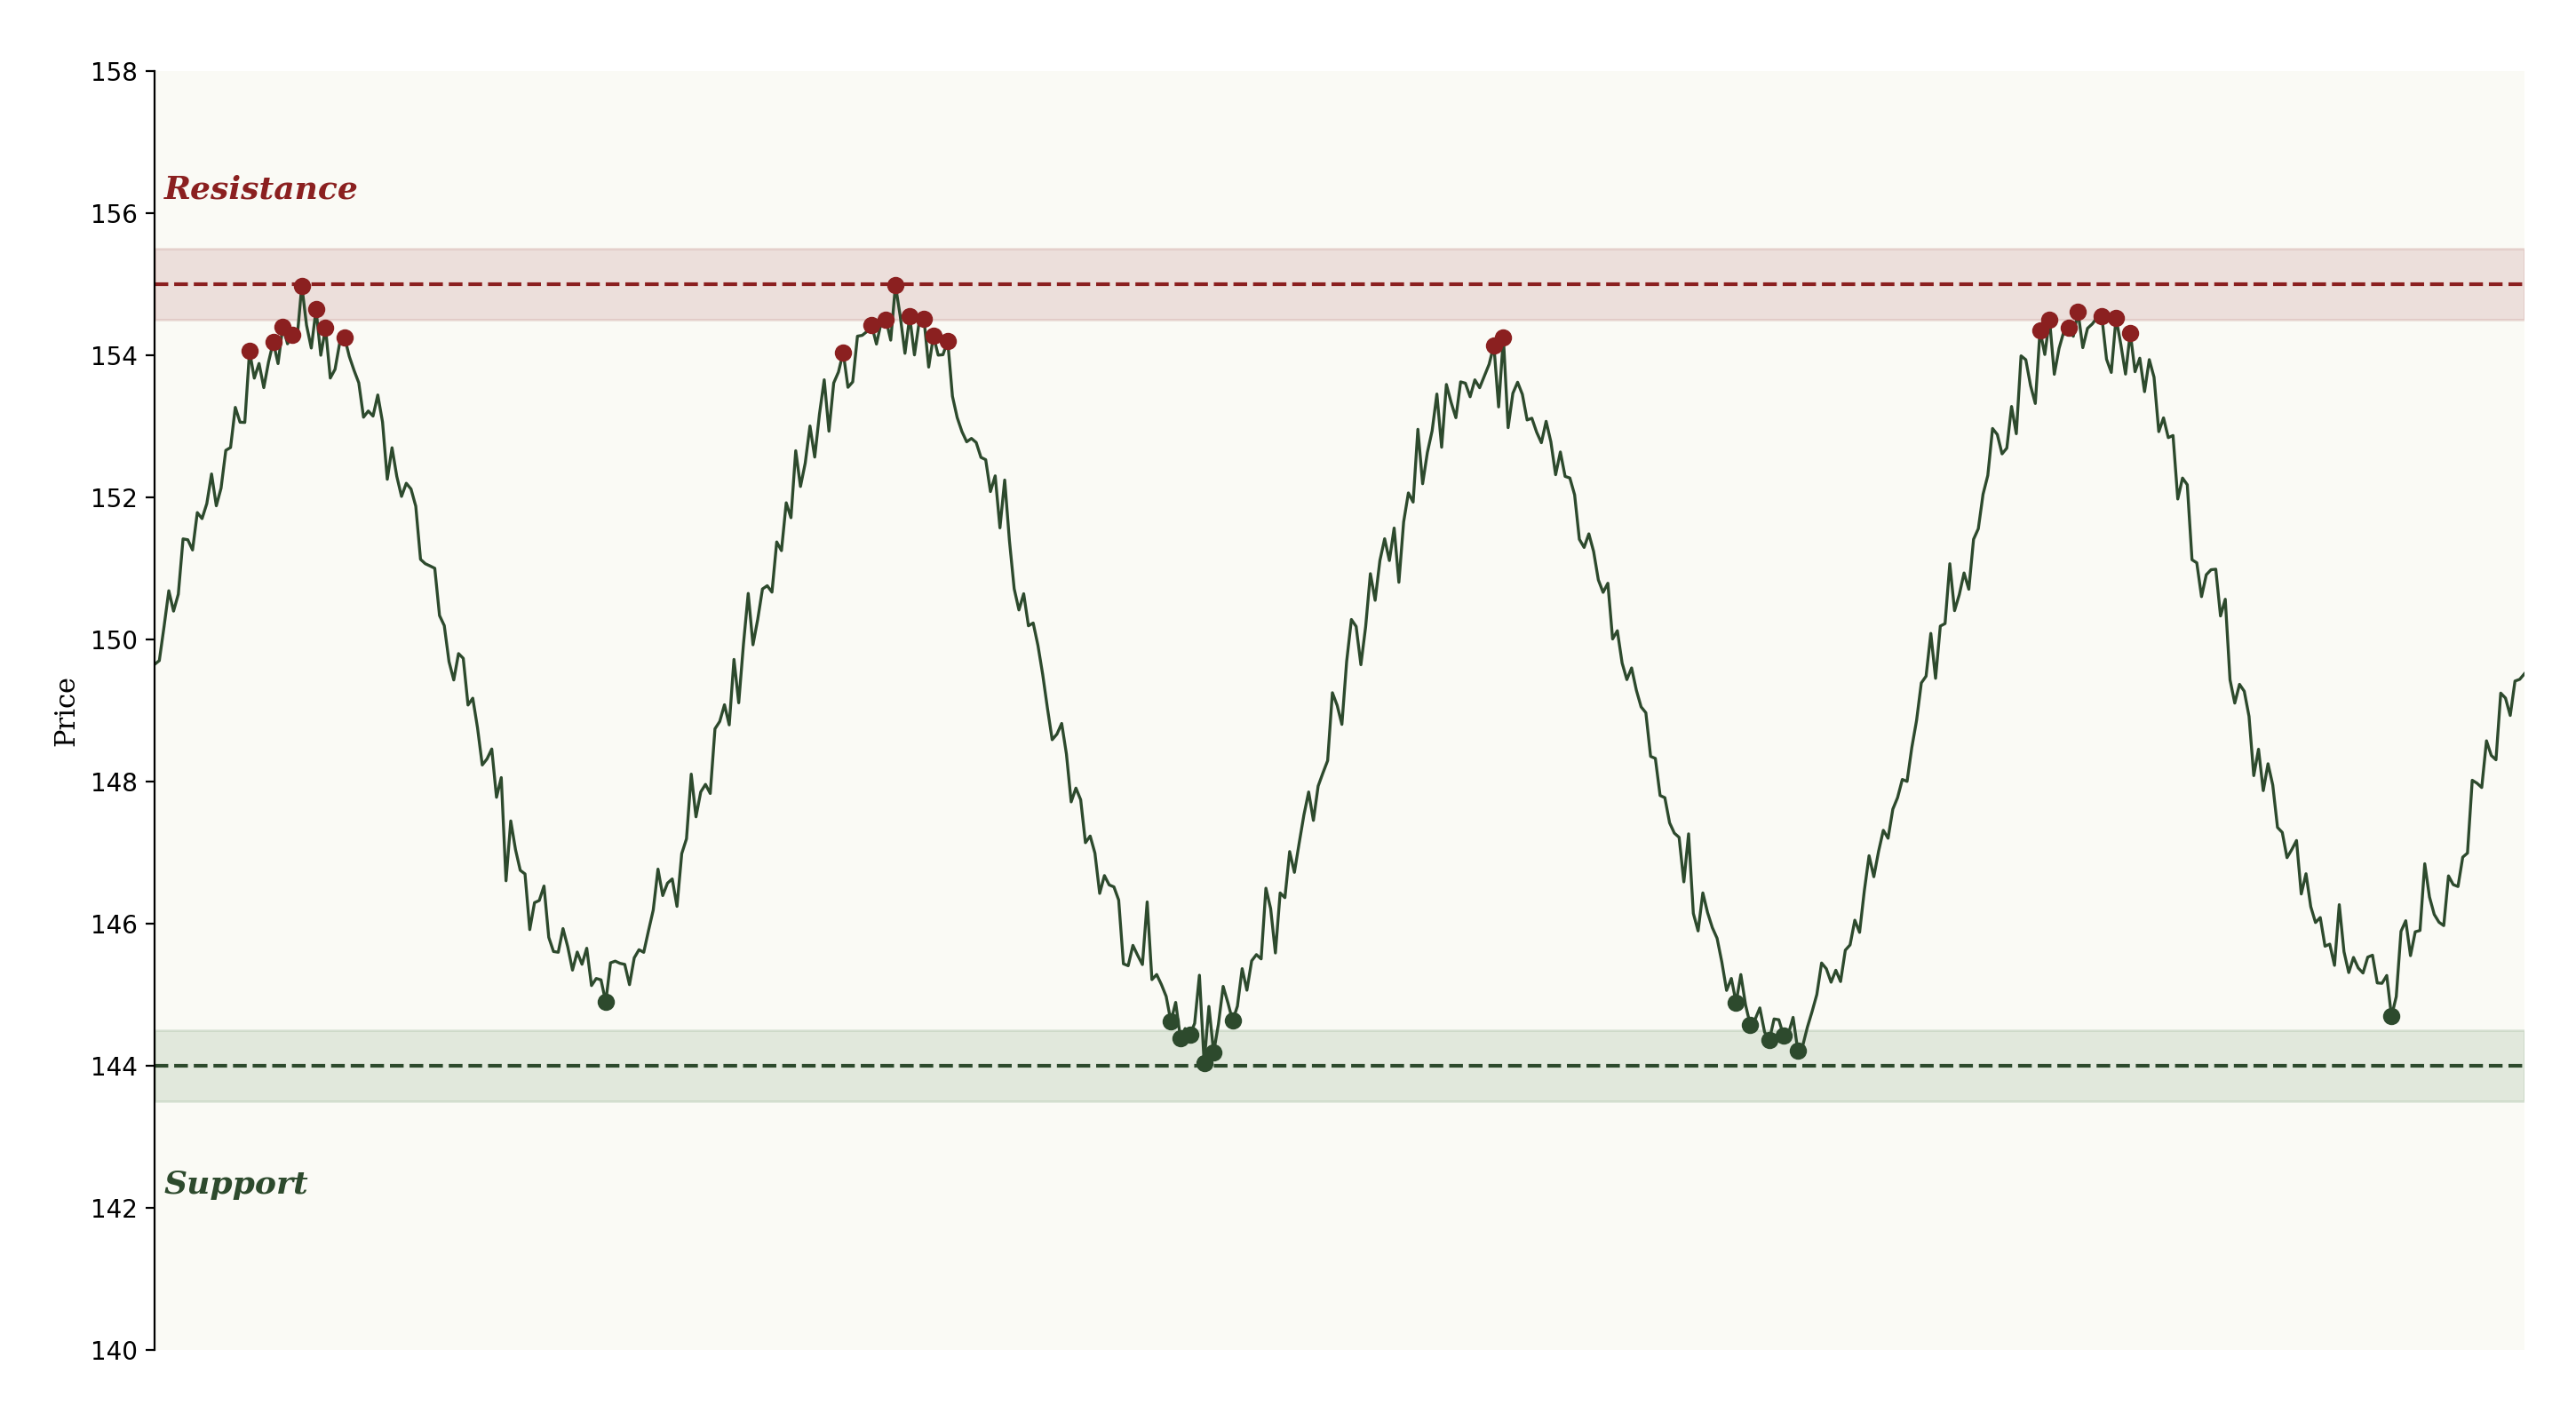
Support is a price level where buyers consistently step in. Think of it as a floor. The price drops to this level, buyers appear, and the price bounces. The more times a support level holds, the more significant it becomes — because more traders are watching it and more orders are stacked around it.
Resistance is a price level where sellers consistently appear. Think of it as a ceiling. The price rises to this level, sellers come in, and the price gets pushed back down.
These levels are powerful because they create self-reinforcing behaviour. If a stock bounces off 150 three times, thousands of traders set buy orders at 150 for the next time it gets there. That wall of buy orders becomes the support itself. It's a crowd-sourced floor.
Support and resistance levels are where you set your entries and exits. When the algorithm generates an entry signal, it's often identifying a support level where the probability of a bounce is high. When it generates an exit signal, it's identifying resistance where the probability of a pullback increases.
What a Breakout Looks Like
A breakout is when price moves through a support or resistance level with conviction. This is one of the most powerful events in trading because it often signals the beginning of a new trend or the acceleration of an existing one.
Imagine a stock has been bouncing between 100 and 110 for three months. Every time it hits 110, sellers push it back down. Every time it hits 100, buyers push it back up. The range is established.
Then one morning, the stock opens at 109 and pushes through 110. But instead of pulling back like it has every other time, it keeps going. 111. 112. 114. Volume is two or three times normal. Something has changed. The sellers who defended 110 for three months are gone — or they've been overwhelmed by a wave of buying that is stronger than anything the range has seen.
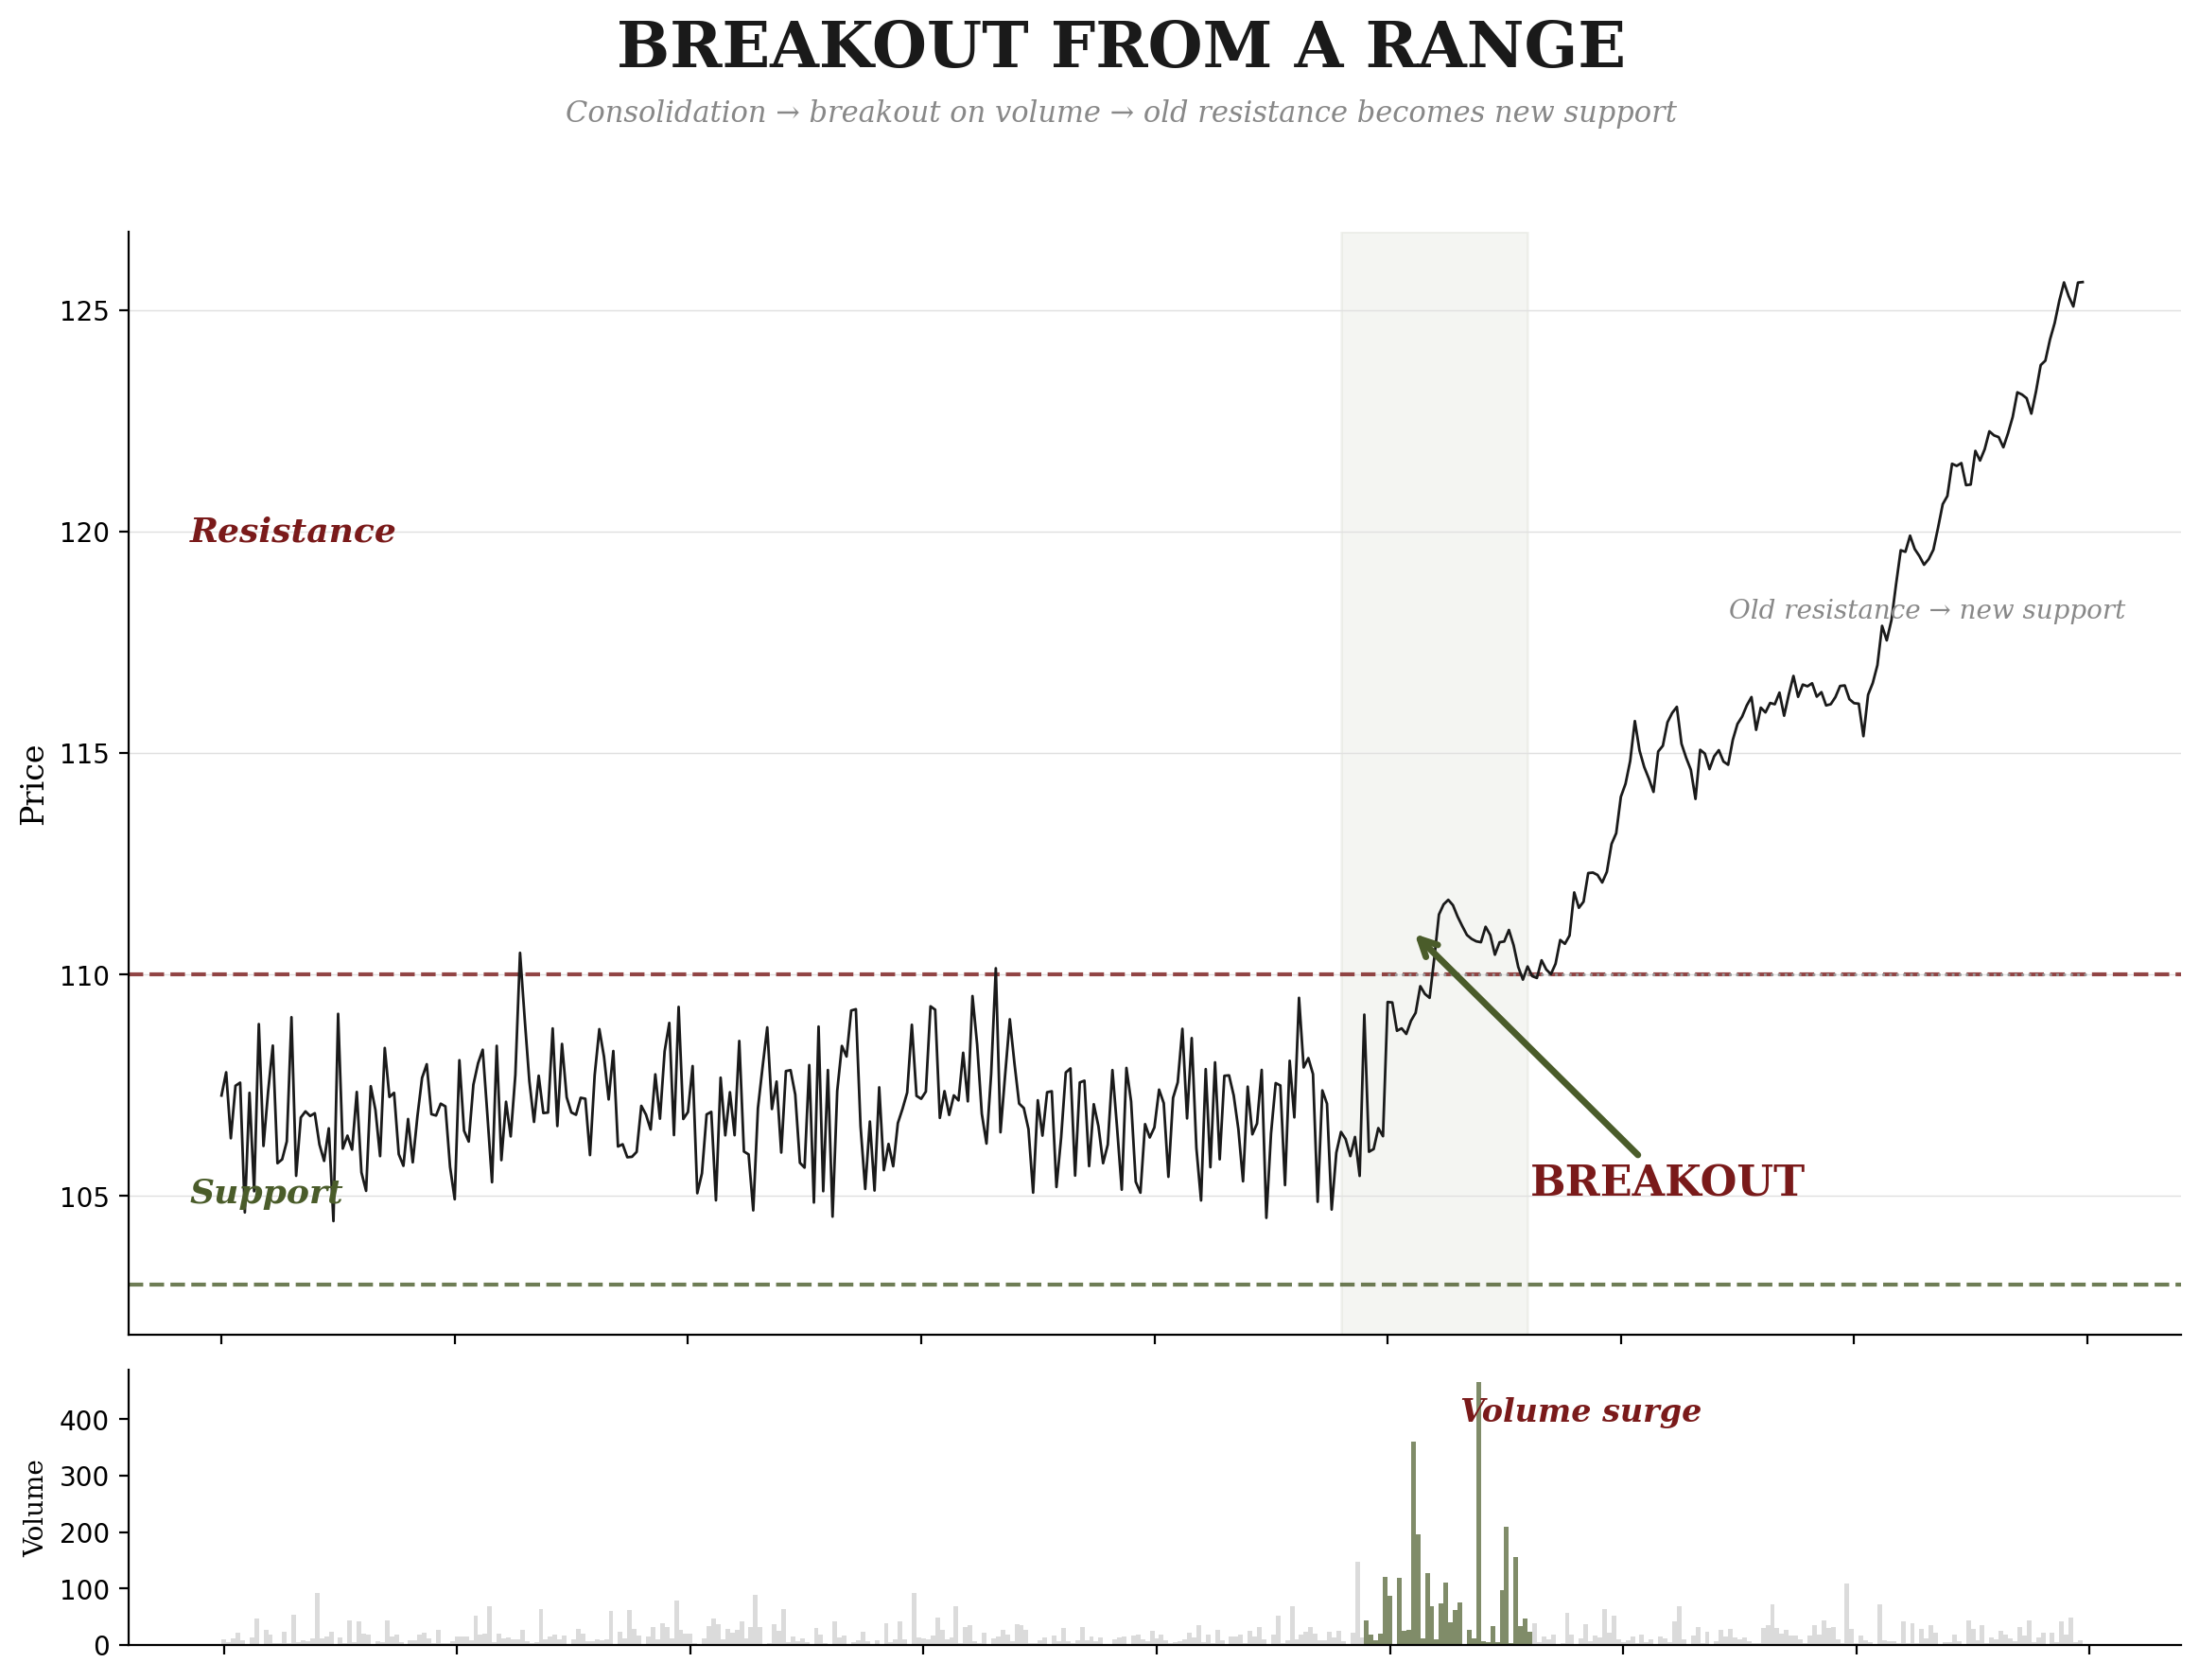
That's a breakout. And the move from 110 to 120 or 130 often happens faster than the entire three months of sideways action that preceded it. Months of coiling energy, released in days.
The flip side is a breakdown. If the stock had cracked below 100 with volume, that would be the sellers taking control. The floor is gone. The buyers who defended 100 have either given up or run out of ammunition.
Volume: The Confirmation Signal
Price tells you what's happening. Volume tells you how seriously to take it.
Volume is the number of shares or contracts traded during a given period. High volume means lots of participants are active. Low volume means very few. And the difference between the two can be the difference between a real move and a trap.
A price move on high volume is meaningful. It means many market participants agree with the direction. A breakout above resistance on triple-normal volume is a strong signal — real money is driving that move.
A price move on low volume is suspicious. Imagine that same 100–110 range. The stock pushes above 110 to 112. It looks like a breakout. A dozen traders pile in, excited. But the volume is half of normal. No institutional participation. No conviction. Three days later, the stock is back at 106. The "breakout" was a trap.
Volume is the lie detector of the market. Price can fake a move. Volume can't.
How to Read a Chart in 30 Seconds
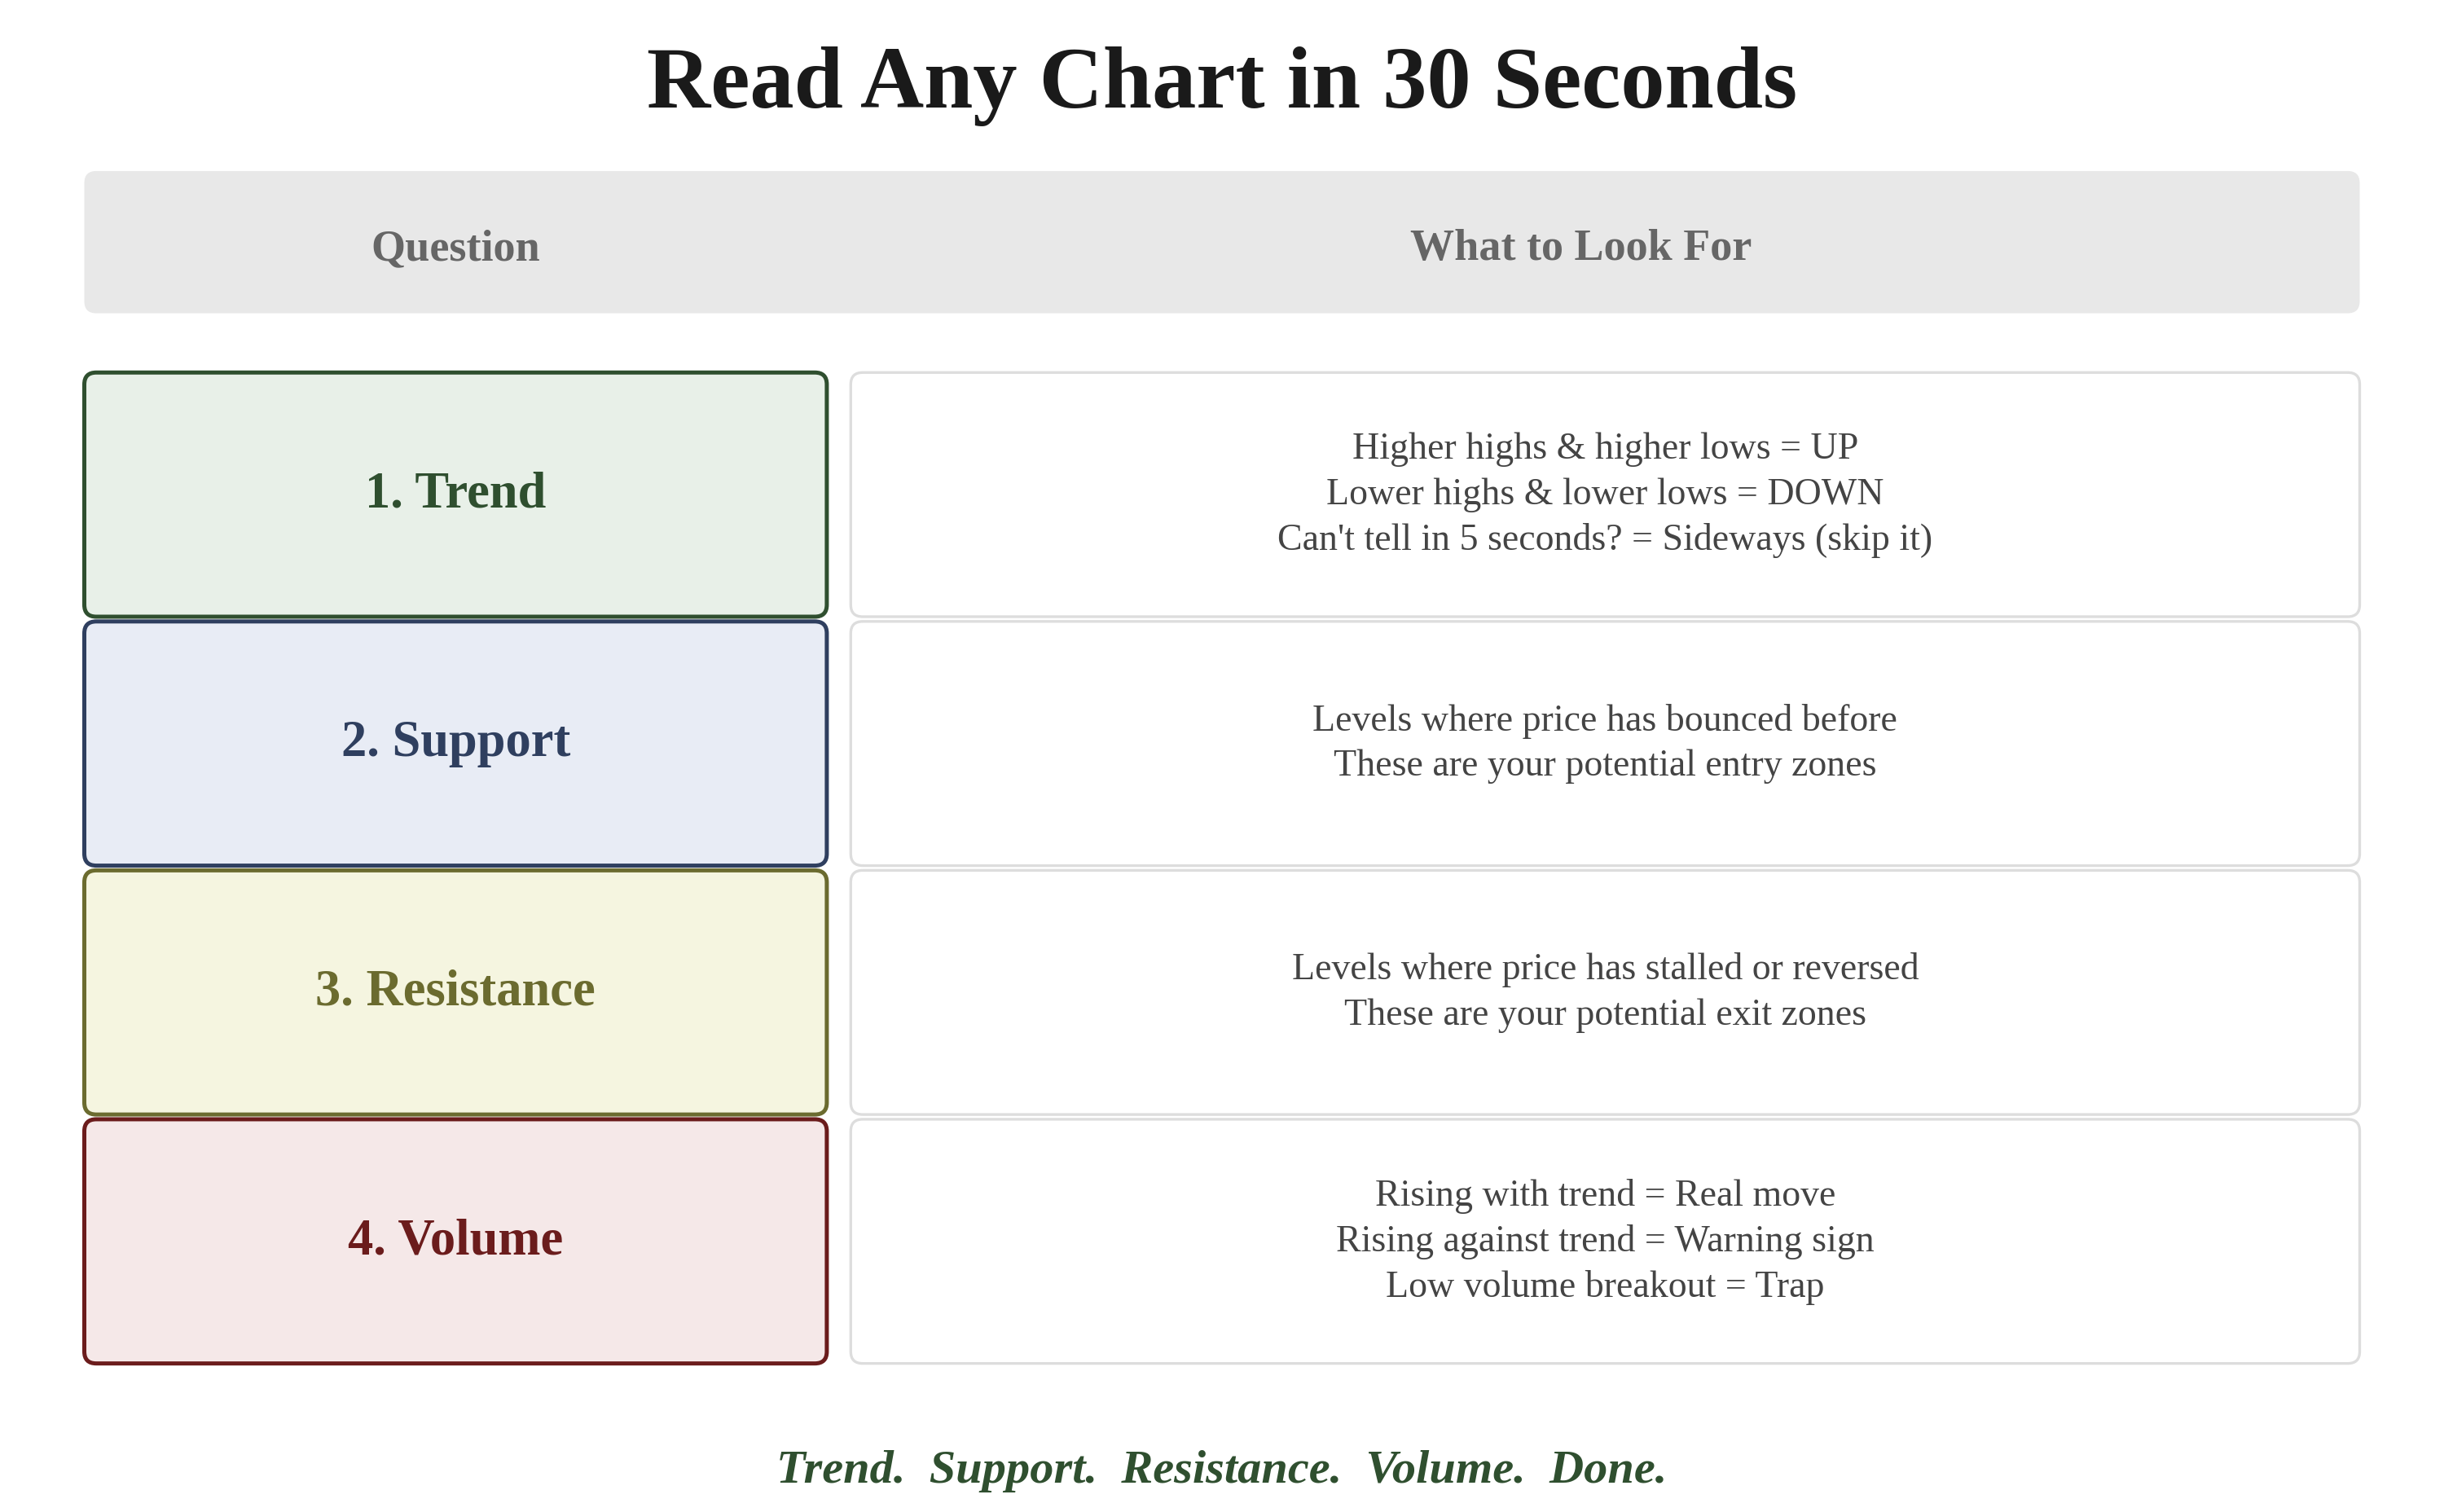
You don't need to stare at charts for hours. When you pull up any chart, ask yourself these four questions in order:
- What's the trend? Higher highs and higher lows? Lower highs and lower lows? Or sideways? If you can't tell in five seconds, it's probably sideways — which means you probably don't want to trade it.
- Where is support? Look for the levels where price has bounced before. These are your potential entry zones.
- Where is resistance? Look for the levels where price has stalled or reversed. These are your potential exit or profit-taking zones.
- What's volume doing? Is volume increasing on moves in the trend's direction? That's healthy. Is volume increasing on moves against the trend? That's a warning sign.
That's the entire chart reading process. Trend, support, resistance, volume. Four things. You can assess any chart in the world in thirty seconds if you know what you're looking for.
You pull up a stock chart. Within five seconds: price is making higher highs and higher lows. Uptrend. You see price bounced at 145 three times — that's your support. Price stalled at 165 twice — that's your resistance. Volume is rising on up days and fading on pullbacks — healthy confirmation.
If your macro regime says this sector should be performing well, you're looking at a potential Grade A or B setup. Total time: 30 seconds.
What Charts Can't Tell You
Charts are powerful, but they're not crystal balls. They won't tell you about an earnings surprise before it happens. They won't warn you about a pandemic or a war. They won't predict a regulatory change or a CEO getting fired.
But here's what they will tell you: how the smart money is positioning before those events become obvious.
In late 2021, while financial TV was still celebrating all-time highs in the stock market and telling viewers to keep buying, the charts were telling a very different story. High-growth technology stocks were making lower highs. Volume was increasing on down days and drying up on rallies — a classic distribution pattern. The smart money was quietly selling while the headlines were still bullish.
The charts didn't predict the crash. They showed you what was already happening beneath the surface — a quiet, systematic exit by the people with the best information. That's worth more than any analyst's prediction. Our verified track record shows how reading these signals translates into real returns.
Combine this with the macro regime framework and you have the full picture. When macro and chart agree, trade it. When they disagree, stay away. This is exactly how our signal products combine macro and price action into clear Grade A-E conviction ratings.
Next, we apply everything — macro regimes, conviction grades, price action, and chart reading — to the specific mechanics of swing trading.
- 1.Only four things matter: trend (higher highs/higher lows), support, resistance, and volume confirmation.
- 2.You can read any chart in 30 seconds using these four elements — everything else is overcomplicated noise.
- 3.Volume is the lie detector of the market — price can fake a move, but volume can't.
This content is for educational purposes only and does not constitute investment advice. Trading and investing involve substantial risk of loss. Past performance is not indicative of future results. Always do your own research and consider seeking professional guidance before making financial decisions.